


Tech Stocks FANG Index Nearing Critical Support – Could Breakout At Any Moment
Companies / Tech Stocks Sep 12, 2020 - 03:54 PM GMTBy: Chris_Vermeulen

RESEARCH HIGHLIGHTS:
- The washout-low price move in FANG stocks may present a needed rotation in price before another upside move sets up.
- Tweezer Bottoms pattern and RSI pennant formation suggest very clear support levels.
- Watch how Volume and the VIX pick up over the next few days, and how price reacts to this bounce at 945.
Our Custom FANG Index (consisting of Facebook, Microsoft, Twitter, Amazon, Google, and Nvidia) shows the FANG Index, and technology sector, are trading just above critical support near 945. The congestion area on this chart between July and August just below this 945 level highlights the key resistance/support level that we are currently watching as price support.
TWEEZER BOTTOMS MAY SUGGEST MORE UPSIDE POTENTIAL
This Custom FANG Index Weekly chart clearly slows the Tweezer Bottoms pattern that formed in the markets after the close on Tuesday, September 8, 2020. This pattern suggests a very clear support level is found near the recent lows – near 945. If this support level holds, then the FANG Index price should begin to bounce and move higher. If this support level is broken, prices may continue to push lower while attempting to find historical support levels.
The Fibonacci Price Amplitude Arcs suggest a broader price frequency inflection point is also setting up near the recent peak. This Fibonacci Price Amplitude Arc suggests a major inflection point is taking place in the Custom FANG index right now. We believe the 945 level resulting from the Tweezer Bottoms pattern is a critical price level to support a future price rally in this sector.
Lastly, we want to point out the Pennant/Flag formation in the RSI indicator over the past 8+ months (highlighted in RED). The combination of these technical patterns, as well as the new Tweezer Bottoms pattern, suggests the current breakdown to the 945 level may present a “washout-low” type rotation after the RSI Pennant Apex. Overall, this downside move in the FANG index represents a moderately strong APEX rotation. If this is a “washout” rotation, then we may be setting up for another big upside price move soon.
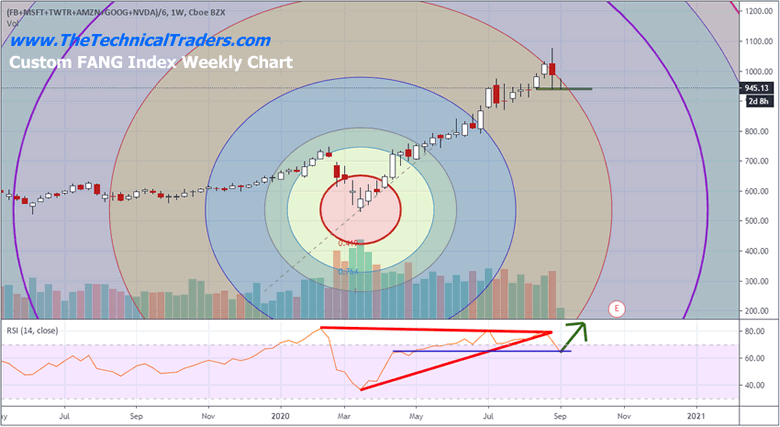
Right now, we are cautiously watching the 945 level and expecting the Custom FANG Index to recover from these Tweezer Bottoms lows. We believe there is a very solid chance that the washout-low price move may present a needed rotation in price before another upside move sets up.
Watch for the markets and technology sector to attempt a recovery as long as the 945 level on this Custom FANG Index chart holds. Isn’t it time you learned how I can help you better understand technical analysis as well as find and execute better trades? If you look back at past research, you will see that my incredible team and our proprietary technical analysis tools have accurately shown you what to expect from the markets in the future. Do you want to now learn how to profit from these expected moves? If so, sign up for my Active ETF Swing Trade Signals today!
If you have a buy-and-hold or retirement account and are looking for long-term technical bull/bear signals for when to buy and sell equities, bonds, precious metals, or sit in cash then be sure to subscribe to my Passive Long-Term ETF Investing Signals to stay ahead of the market and protect your wealth!
Chris Vermeulen
www.TheTechnicalTraders.com
Chris Vermeulen has been involved in the markets since 1997 and is the founder of Technical Traders Ltd. He is an internationally recognized technical analyst, trader, and is the author of the book: 7 Steps to Win With Logic
Through years of research, trading and helping individual traders around the world. He learned that many traders have great trading ideas, but they lack one thing, they struggle to execute trades in a systematic way for consistent results. Chris helps educate traders with a three-hour video course that can change your trading results for the better.
His mission is to help his clients boost their trading performance while reducing market exposure and portfolio volatility.
He is a regular speaker on HoweStreet.com, and the FinancialSurvivorNetwork radio shows. Chris was also featured on the cover of AmalgaTrader Magazine, and contributes articles to several leading financial hubs like MarketOracle.co.uk
Disclaimer: Nothing in this report should be construed as a solicitation to buy or sell any securities mentioned. Technical Traders Ltd., its owners and the author of this report are not registered broker-dealers or financial advisors. Before investing in any securities, you should consult with your financial advisor and a registered broker-dealer. Never make an investment based solely on what you read in an online or printed report, including this report, especially if the investment involves a small, thinly-traded company that isn’t well known. Technical Traders Ltd. and the author of this report has been paid by Cardiff Energy Corp. In addition, the author owns shares of Cardiff Energy Corp. and would also benefit from volume and price appreciation of its stock. The information provided here within should not be construed as a financial analysis but rather as an advertisement. The author’s views and opinions regarding the companies featured in reports are his own views and are based on information that he has researched independently and has received, which the author assumes to be reliable. Technical Traders Ltd. and the author of this report do not guarantee the accuracy, completeness, or usefulness of any content of this report, nor its fitness for any particular purpose. Lastly, the author does not guarantee that any of the companies mentioned in the reports will perform as expected, and any comparisons made to other companies may not be valid or come into effect.
Chris Vermeulen Archive |
© 2005-2022 http://www.MarketOracle.co.uk - The Market Oracle is a FREE Daily Financial Markets Analysis & Forecasting online publication.