


Look at This Big Reminder of Dot.com Stock Market Mania
Stock-Markets / Tech Stocks Sep 15, 2020 - 05:39 PM GMTBy: EWI

Here’s when a surge in IPOs tends to occur
Let's pretend for a second we're trying to explain to an alien how the weather works on planet Earth.
When the sky turns dark and cloudy, we might tell him, this indicates rain -- perhaps even thunderstorms. However, cloudy skies do not necessarily signal when a downpour will start or how long it will last if it does start. After all, the sun could break through before an umbrella is needed. All that said, when the sky turns ominous, it's a good idea to have your umbrella handy -- just in case.
Now let's pretend we're talking to a brand-new investor and apply the same explanation to some less-talked-about stock market indicators. They "indicate" but don't guarantee a particular market development. Nor its timing should it develop. But, it's a good idea for investors to be on alert.
One such stock market indicator is the initial public offerings market. It got red hot around the peak of the dot.com frenzy back in the year 2000 and also near the time of the 2007 stock market top.
With that in mind, the just-published September Elliott Wave Financial Forecast, a monthly publication which provides forecasts for major U.S. financial markets, discusses the IPO market here in 2020. Here's a chart and commentary:
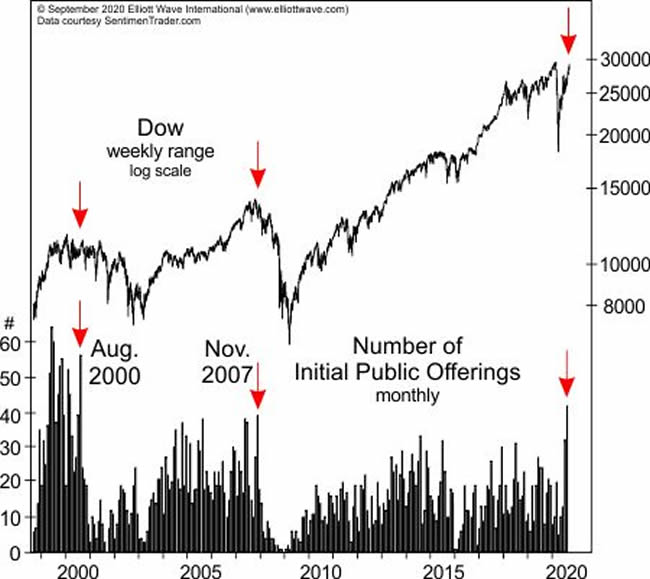
It's official; the market for initial public offerings is as hot as it's been since the dot.com mania. The chart shows the monthly total for IPOs starting in 1999. In terms of deals, the boom of the late 1990s is still of a larger scale, but the 42 offerings in July of this year is the highest total since August 2000. The second highest total since 2000 came in November 2007, when 39 IPOs came to market just as the 2007-2009 bear market started. A surge in IPOs tends to occur around major stock market tops, with a final last-gasp spike taking place after the stock market peaks.
Indeed, here's a Barron's headline from August 31, 2020:
Get Ready for a Crazy Wave of IPOs.
What's more, the September Financial Forecast also points out that, similarly to 1999 and 2000, many IPOs and prospective IPOs today are money losers, or even lack revenues.
As financial history suggests, such unbridled optimism usually does not last indefinitely.
Now, as suggested a moment ago, the IPO market is an indicator -- and a single one at that. It does not say whether the stock market will plummet next week, next month or whenever. It simply suggests that an investor should be prepared.
However, the Elliott wave model does offer high-confidence market turn insights.
Learn about this time-tested method for analyzing and forecasting financial markets by reading the online version of Elliott Wave Principle: Key to Market Behavior, by Frost & Prechter, free.
You can acquire the ability to employ the Elliott wave model. It just takes dedication.
Here's a quote from the Wall Street classic:
With a knowledge of the tools in Chapters 1 and 2, any dedicated student can perform expert Elliott wave analysis. Those who neglect to study the subject thoroughly or apply the tools rigorously give up before really trying. The best learning procedure is to keep an hourly chart and try to fit all the wiggles into Elliott wave patterns while keeping an open mind for all the possibilities. Slowly the scales should drop from your eyes, and you will be continually amazed at what you see.
It is important to remember that while investment tactics always must go with the most valid wave count, knowledge of alternative interpretations can be extremely helpful in adjusting to unexpected events, putting them immediately into perspective, and adapting to the changing market framework. The rigid rules of wave formation are of great value in narrowing the infinite possibilities to a relatively small list, while flexibility within the patterns eliminates cries that whatever the market is doing now is "impossible."
All that's required for free access to the entirety of Elliott Wave Principle: Key to Market Behavior is a Club EWI membership. You can join Club EWI for free. What's more -- besides gaining free access to Elliott Wave Principle: Key to Market Behavior, a wealth of other Elliott wave resources will become instantly available to you.
The first step is to follow this link: Elliott Wave Principle: Key to Market Behavior -- free access.
This article was syndicated by Elliott Wave International and was originally published under the headline Look at This Big Reminder of "Dot.com Mania". EWI is the world's largest market forecasting firm. Its staff of full-time analysts led by Chartered Market Technician Robert Prechter provides 24-hour-a-day market analysis to institutional and private investors around the world.
© 2005-2022 http://www.MarketOracle.co.uk - The Market Oracle is a FREE Daily Financial Markets Analysis & Forecasting online publication.