


Stock Market Massive Dark Cloud Cover Pattern Is Above Critical Support – Will It Hold?
Stock-Markets / Stock Markets 2020 Oct 03, 2020 - 04:38 PM GMTBy: Chris_Vermeulen

RESEARCH HIGHLIGHTS:
- A Dark Cloud Cover pattern is a Japanese Candlestick Pattern that is typically associated with major top setups.
- Critical Support on the SPY highlighted by multiple technical analysis strategies suggests 335~335.25 is acting as a major support level.
- If price stays below the $339.95 level, then we interpret the trend as being Bearish. If price moves above the $343.55 level, it is Bullish.
Critical Support on the SPY (SPDR S&P500 ETF) highlighted by multiple technical analysis strategies suggests 335~335.25 is acting as a major support level. The rally in the markets that started late Sunday and carried forward into early trading on Monday, September 28, 2020, suggests the market is attempting to rally above this support level to establish a potential momentum base. My advanced price modeling systems and Fibonacci Price Amplitude Arcs (originating from the 2009 bottom) have clearly identified this area as a critical resistance/support zone.
MONTHLY DARK CLOUD PATTERN MAY BE CALLING THE TOP
The first chart below highlights the SPY Monthly chart data and shows the recent peak in price that broke through the major resistance level near 335, then collapsed back below that same level. Prior to this recent collapse, the COVID-19 peak in February also briefly touched this same resistance level – confirming it as valid. We believe the current price activity suggests the markets are attempting to form some sort of price base above this $335 level on the SPY.
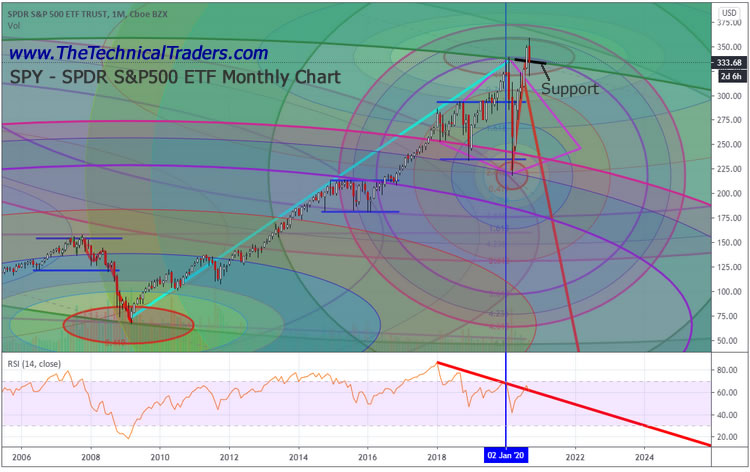
As you can see from the recent highs on the chart above, there is a new Fibonacci Price Amplitude Arc range set up by the COVID-19 collapse that may interrupt this Base Setup process. Look for the smaller OBLIQUE on the chart near where the word “Support” is. This is a new Fibonacci Price Amplitude Arc that reflects the most recent price range activity into targeted Fibonacci based price zones.
If the SPY price falls below the $322 level of the current lower Arc, then the markets will appear to be attempting to break lower. If the SPY price rallies above the $357.50 level, then the markets will appear to be attempting to break higher. The current monthly price bar spans the total height of this new Fibonacci Price Amplitude Arc – thus it is suggesting a volatile type of topping pattern is setting up. If today was the last trading day of the month, this Monthly chart pattern would set up a very large Dark Cloud Cover pattern – a major topping pattern.
Before you continue, be sure to opt-in to our free-market trend signalsnow so you don’t miss our next special report!
A Dark Cloud Cover pattern is a Japanese Candlestick Pattern that is typically associated with major top setups. It represents a clear change in trend direction when a new “Filled” (RED) candle opens above the previous “Empty” (WHITE) candle’s closing price and the “Filled” candle closes below the midpoint of the “Empty” candle’s body. In the chart below, the size of the pattern is very relevant because it is setting up near a major price peak after volatility has increased to nearly 2x or 3x normal volatility ranges. This pattern is a classic topping formation pattern and we’ll have to see how the next few trading days play out.
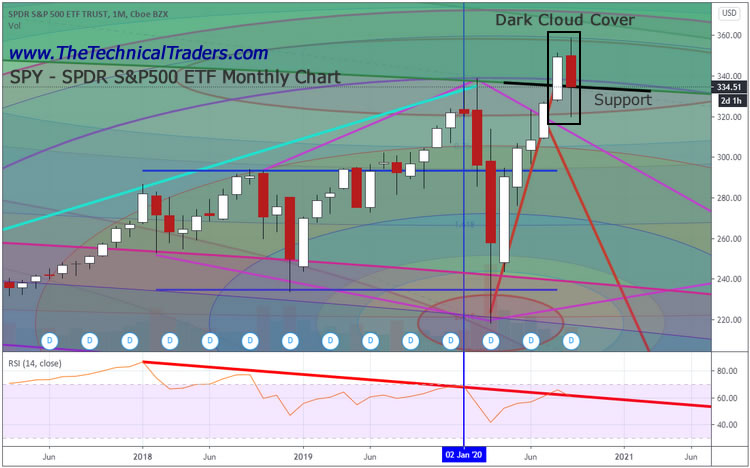
If the SPY price is able to rally above the $339 price level, then this pattern changes into an Incomplete Dark Cloud Cover pattern – waiting for a breakdown technical confirmation in price to confirm a major top setup. If the SPY price stays below the $339 level, then this pattern stays a Dark Cloud Cover pattern which would still require technical confirmation – but become much more ominous related to the bigger “monthly” picture for the US stock market. It becomes an even scarier pattern when you consider we are just weeks away from a Presidential election event.
When we pair this research with our Adaptive Fibonacci Price Modeling system, it become clear there are two major levels we should all be watching on the SPY charts. The first is the Bearish Fibonacci Price Trigger level near $339.95 and the second is the Bullish Fibonacci Price Trigger Level near $343.55. With such a narrow range between these two trigger levels, we interpret the range between them as “neutral”. If price stays below the $339.95 level, then we interpret the trend as being Bearish. If price moves above the $343.55 level, then we interpret the trend as being Bullish.
We urge you to pay attention to how these levels align together across different types of Fibonacci price analysis/modeling. When this happens, we believe our modeling systems are pinpointing very accurate trigger price levels that become major support/resistance areas on the charts.
You’ll also notice the various Arcing levels on this Weekly SPY chart (below) that represent our Fibonacci Price Amplitude Arcs on a Weekly chart basis. Clearly, there is a GREEN ARC very near the current support level and current price level on the SPY. This GREEN ARC is the most immediate support zone on the SPY. If this level is breached to the downside, then we will immediately target the $310 or $280 level as prices collapse.
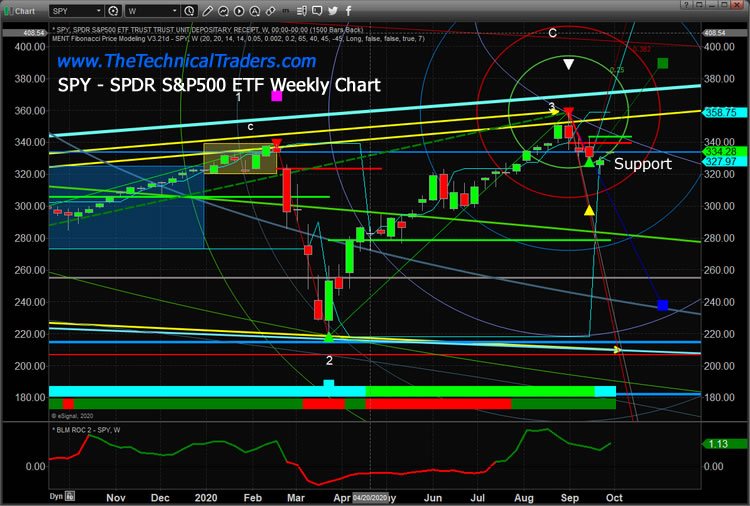
Our previous modeling system support suggests the $334.25 level as support. Taken all together, we have a bunch of support levels above $334 and a bunch of resistance levels above $343. With the current Dark Cloud Cover setup, we believe the markets are poised for an attempted downside price move – a big breakdown is possible if $334 does not hold. We will need to see the $339 and $334 levels hold over the next few weeks in order for the SPY to move higher. These Fibonacci Price Amplitude Arcs are suggesting major price volatility is pending. The Dark Cloud Cover on the Monthly chart suggests a big ominous topping pattern has setup. It’s pretty clear to see that we could be in for a big breakdown in price if these support levels are breached.
Stay safe. Avoid risky positions if you can. This move could unload to the downside in a hurry. Remember, the SPY price must stay above $334 to stay somewhat Bullish – and even then we are not completely safe from a big breakdown in the markets. Unless the SPY rallies above $351 before the end of this month, some type of major topping Japanese Candlestick Pattern will setup.
I will be speaking at the upcoming Special Election Edition Wealth365 Summit in less than two weeks from now. This multi-day event includes political speakers – James Carville, Mary Matalin, Donna Brazile, Jason Chaffetz – as well as many of the legendary traders and technical analysts I have had the benefit to learn from over the years. If you haven’t already registered, make sure you do so right now by Clicking Here: https://summit.Wealth365.com/The-Technical-Traders. Without exception, this is where you need to be in order to set yourself up for success for the remainder of 2020 and into 2021. See you there!
This market, the future setups described above, and the profits lying therein are fantastic opportunities for skilled technical traders to capitalize on. Isn’t it time you learned how I can help you find and execute better trades? My incredible technical analysis team and our proprietary tools have just shown you what to expect 6+ months into the future. Do you want to learn how to profit from these huge moves? Sign up for my Active ETF Swing Trade Signals today! If you have a buy-and-hold account and are looking for long-term technical signals for when to buy and sell equities, bonds, or cash, be sure to subscribe to my Passive Long-Term ETF Investing Signals.
Stay healthy and rest easy at night by staying informed of market trends with The Technical Traders!
Chris Vermeulen
www.TheTechnicalTraders.com
Chris Vermeulen has been involved in the markets since 1997 and is the founder of Technical Traders Ltd. He is an internationally recognized technical analyst, trader, and is the author of the book: 7 Steps to Win With Logic
Through years of research, trading and helping individual traders around the world. He learned that many traders have great trading ideas, but they lack one thing, they struggle to execute trades in a systematic way for consistent results. Chris helps educate traders with a three-hour video course that can change your trading results for the better.
His mission is to help his clients boost their trading performance while reducing market exposure and portfolio volatility.
He is a regular speaker on HoweStreet.com, and the FinancialSurvivorNetwork radio shows. Chris was also featured on the cover of AmalgaTrader Magazine, and contributes articles to several leading financial hubs like MarketOracle.co.uk
Disclaimer: Nothing in this report should be construed as a solicitation to buy or sell any securities mentioned. Technical Traders Ltd., its owners and the author of this report are not registered broker-dealers or financial advisors. Before investing in any securities, you should consult with your financial advisor and a registered broker-dealer. Never make an investment based solely on what you read in an online or printed report, including this report, especially if the investment involves a small, thinly-traded company that isn’t well known. Technical Traders Ltd. and the author of this report has been paid by Cardiff Energy Corp. In addition, the author owns shares of Cardiff Energy Corp. and would also benefit from volume and price appreciation of its stock. The information provided here within should not be construed as a financial analysis but rather as an advertisement. The author’s views and opinions regarding the companies featured in reports are his own views and are based on information that he has researched independently and has received, which the author assumes to be reliable. Technical Traders Ltd. and the author of this report do not guarantee the accuracy, completeness, or usefulness of any content of this report, nor its fitness for any particular purpose. Lastly, the author does not guarantee that any of the companies mentioned in the reports will perform as expected, and any comparisons made to other companies may not be valid or come into effect.
Chris Vermeulen Archive |
© 2005-2022 http://www.MarketOracle.co.uk - The Market Oracle is a FREE Daily Financial Markets Analysis & Forecasting online publication.