The Copper/Gold Ratio Would Change the Macro
Commodities / Copper Oct 21, 2020 - 02:49 PM GMTBy: Gary_Tanashian
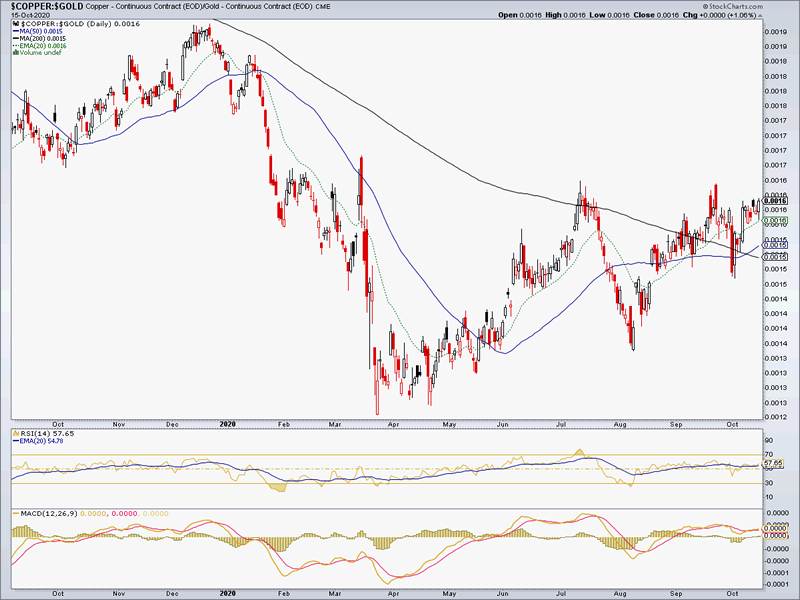
The Copper/Gold ratio is saying something. That something is that a cyclical, pro-inflation and thus pro-economic reflation metal shown earlier, remaining nominally positive on a down market day has, in relation to gold, taken out two important moving averages (daily SMA 50 & SMA 200) and is currently riding the short-term EMA 20 upward. RSI and MACD are positive.
Copper: Pro-cyclical inflation, pro-reflation, pro-economy.
Gold: Counter-cyclical, monetary, with inflationary utility.
Given the right circumstances (like desperate monetary and fiscal policy), which are in play on the wider macro, gold will probably do quite well moving forward. But maybe – for a while – not as well as some commodities if the Copper/Gold ratio really is up to something positive here.

Side note: the Palladium/Gold ratio is on the verge of going positive as well and of course the daddy of inter-metal ratios, the Gold/Silver ratio is still on a big picture breakdown (Silver/Gold has broken above a key long-term resistance marker). So you might want to look at these three metallic indicators together (along with more traditional non-metallic inflation indicators) in gauging the process toward inflation.
If these metals continue their short-term out-performance to gold it would be a strong indicator toward an inflationary 2021. If they break down well, move along, nothing to see here as the ginned up inflation by policy would have failed.
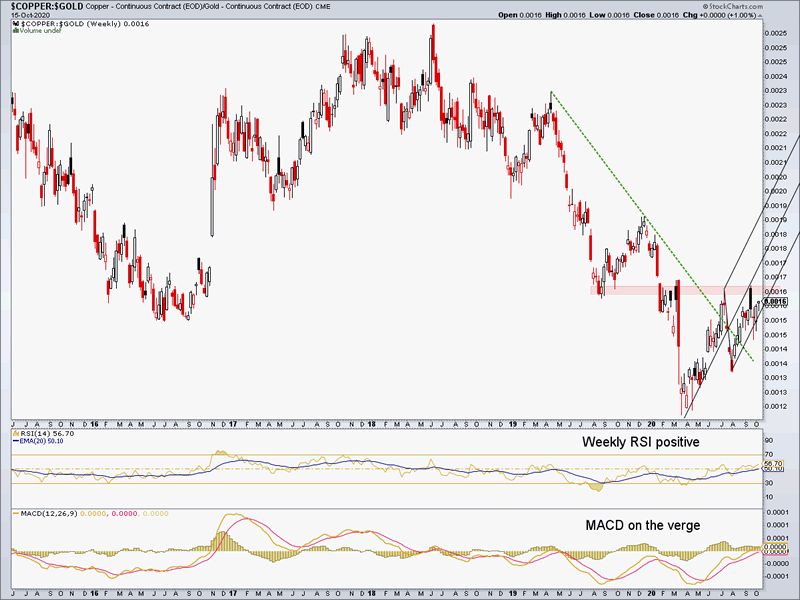
Back to Copper/Gold, the weekly chart shows resistance for the ratio * directly overhead at the July and September highs. Will the 3rd try be a charm in breaking the indicator out to an inflationary 2021? Stay tuned. But understand that if these ratios do start popping the macro is indicated to be going the way that politicians and central bankers want. That would be the inflationary way.

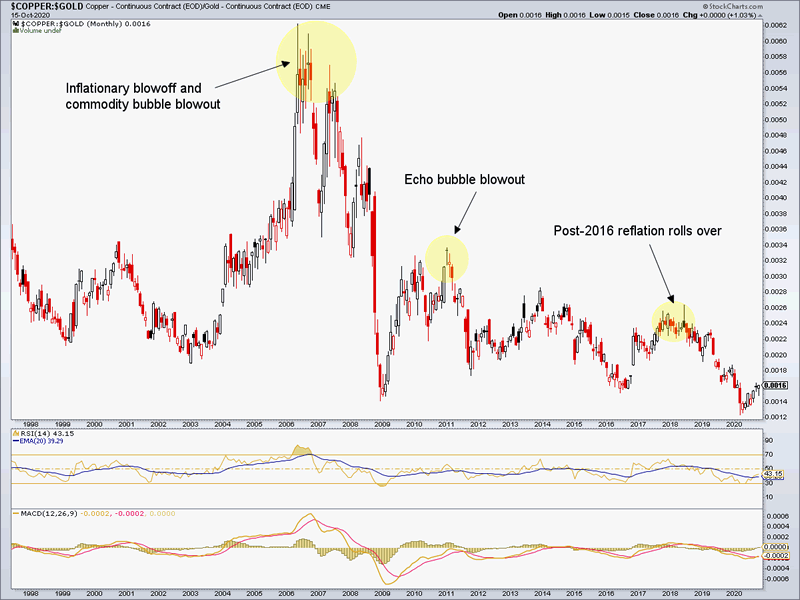
A projected inflation/reflation per the above can play out and still be seen in hindsight (or in our case, foresight) as a bounce within the Deflationary continuum against which our monetary and political policy heroes desperately battle with the only damn tool they know, inflation by (funny) munny printing and bond manipulation. So says this bigger picture monthly chart of Copper/Gold.

Whatever is ahead, make sure you interpret it through actual indicators and facts, not bias and hopes. I feel in my bones that NFTRH will be shifting from managing a successful 2020 that featured a deflation scare that is morphing inflationary to a more obvious inflationary situation in 2021 that will start to gain some traction. Hence, 2020’s investing successes would need to be altered, if not forgotten, in favor of new macro signals. On that note, check out a subscription to Notes From the Rabbit Hole if you’d like a macro guide (complete with stock selections in alignment with said macro) as the world turns.
* Some don’t think indicators are subject to TA concepts like support and resistance, but I do. It’s just that the inputs that form ratio charts are noisier, busier and more plentiful. But they are there.
Subscribe to NFTRH Premium (monthly at USD $33.50 or a 14% discounted yearly at USD $345.00) for an in-depth weekly market report, interim market updates and NFTRH+ chart and trade setup ideas, all archived/posted at the site and delivered to your inbox.
You can also keep up to date with plenty of actionable public content at NFTRH.com by using the email form on the right sidebar and get even more by joining our free eLetter. Or follow via Twitter ;@BiiwiiNFTRH, StockTwits or RSS. Also check out the quality market writers at Biiwii.com.
By Gary Tanashian
© 2020 Copyright Gary Tanashian - All Rights Reserved
Disclaimer: The above is a matter of opinion provided for general information purposes only and is not intended as investment advice. Information and analysis above are derived from sources and utilising methods believed to be reliable, but we cannot accept responsibility for any losses you may incur as a result of this analysis. Individuals should consult with their personal financial advisors.
Gary Tanashian Archive |
© 2005-2022 http://www.MarketOracle.co.uk - The Market Oracle is a FREE Daily Financial Markets Analysis & Forecasting online publication.


