


Stock Market SPY Channeling lower Ahead of US Election Result
Stock-Markets / Stock Markets 2020 Nov 03, 2020 - 02:55 PM GMTBy: Chris_Vermeulen

From a simple technical standpoint, we’ve seen a number of recent breakdowns in the SPY related to Fibonacci Price Theory and Price Gap Theory. One of the most critical components of the recent 60+ days price activity in the SPY is the failed new high on October 12. This failed attempt to rally above the previous high price level, near 358.82, suggests a broader market price decline has setup (a downtrend).
SPY 240 MINUTE CHART
After the failed new high peak on October 12, a series of new downside price gaps can be seen in the SPY chart below as price accelerated downward. These unfilled price gaps represent price acceleration to the downside and will eventually exhaust – creating a new momentum base/bottom.
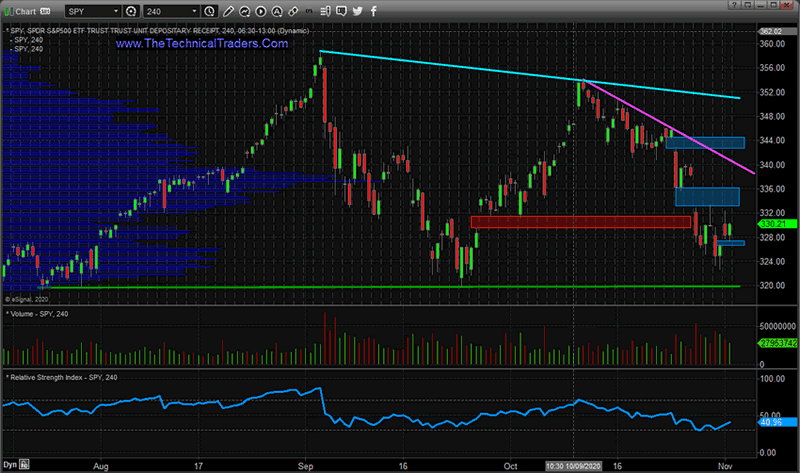
I believe the support level near 319.85 is a critical level for price going forward. The downward price trend suggests this 319.85 level could be targeted very quickly. The November 3 election day, and the post-election price volatility, could put this critical price support level near the top of everyone’s charts over the next few days.
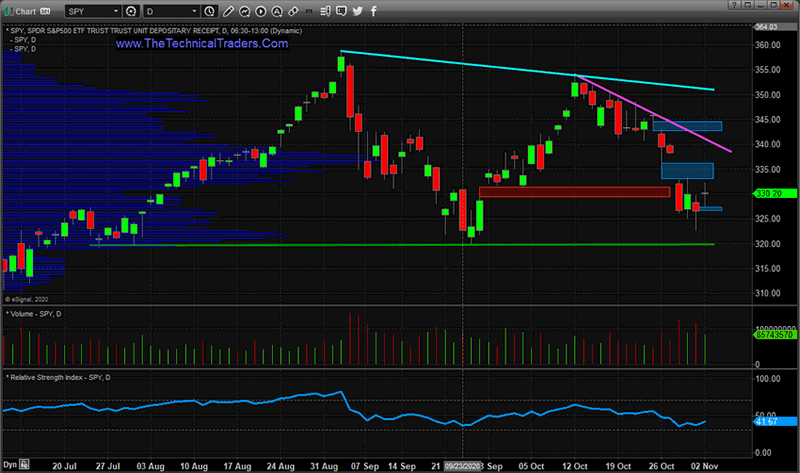
SPY DAILY CHART
My researchers and I believe the upside “island price level” that has set up on November 2 is likely to prompt a downward price move near resistance at 330.25. This type of upward gapping price “island” is indicative of a Three River Evening Star type of setup – which is typically indicative of major resistance and suggests further downside price action may unfold.
Before you continue, be sure to opt-in to our free market trend signals before closing this page, so you don’t miss our next special report!
You can clearly see the Doji bar on the right side of the following Daily SPY chart below the most recent downside price gap near 333.10. The rejection of the rally in price on this bar suggests a real battle for control of trend is taking place. When a Doji forms above the previous candle’s real body, it suggests key resistance is found near the real body of the Doji.
Our researchers believe broader market weakness may become a real factor after the elections pushing price lower to retest the 319.85 support level. Skilled traders should be warned that the 319.85 level represents a key low price level that created the Monthly Dark Cloud Cover pattern we have been suggesting all readers pay attention to. If price blows below this 319.85 level, we may enter a new phase of downward price trending.
Ultimately, we believe the markets will attempt to find support and stage another attempt at nussew all-time highs – but that may not happen before a wash-out low price rotation takes place after the US elections and after the new COVID-19 issues subside. Right now, traders need to stay very cautious of any potential breakdown risks.
Learn how my team called the Dark Cloud Cover pattern over 30 days ago and how we can help you find and execute better trades. We can help grow your trading account with our Swing Trading service and protect your investment account with our long-term market signals service. Visit www.TheTechnicalTraders.com today to earn more.
Chris Vermeulen
www.TheTechnicalTraders.com
Chris Vermeulen has been involved in the markets since 1997 and is the founder of Technical Traders Ltd. He is an internationally recognized technical analyst, trader, and is the author of the book: 7 Steps to Win With Logic
Through years of research, trading and helping individual traders around the world. He learned that many traders have great trading ideas, but they lack one thing, they struggle to execute trades in a systematic way for consistent results. Chris helps educate traders with a three-hour video course that can change your trading results for the better.
His mission is to help his clients boost their trading performance while reducing market exposure and portfolio volatility.
He is a regular speaker on HoweStreet.com, and the FinancialSurvivorNetwork radio shows. Chris was also featured on the cover of AmalgaTrader Magazine, and contributes articles to several leading financial hubs like MarketOracle.co.uk
Disclaimer: Nothing in this report should be construed as a solicitation to buy or sell any securities mentioned. Technical Traders Ltd., its owners and the author of this report are not registered broker-dealers or financial advisors. Before investing in any securities, you should consult with your financial advisor and a registered broker-dealer. Never make an investment based solely on what you read in an online or printed report, including this report, especially if the investment involves a small, thinly-traded company that isn’t well known. Technical Traders Ltd. and the author of this report has been paid by Cardiff Energy Corp. In addition, the author owns shares of Cardiff Energy Corp. and would also benefit from volume and price appreciation of its stock. The information provided here within should not be construed as a financial analysis but rather as an advertisement. The author’s views and opinions regarding the companies featured in reports are his own views and are based on information that he has researched independently and has received, which the author assumes to be reliable. Technical Traders Ltd. and the author of this report do not guarantee the accuracy, completeness, or usefulness of any content of this report, nor its fitness for any particular purpose. Lastly, the author does not guarantee that any of the companies mentioned in the reports will perform as expected, and any comparisons made to other companies may not be valid or come into effect.
Chris Vermeulen Archive |
© 2005-2022 http://www.MarketOracle.co.uk - The Market Oracle is a FREE Daily Financial Markets Analysis & Forecasting online publication.