


Stock Market Dow Futures Reach 30,000 on News of COVID-19 Vaccine Trials Success
Stock-Markets / Stock Markets 2020 Nov 12, 2020 - 07:33 AM GMTBy: Chris_Vermeulen

Early this morning, the US stock market indexes/futures rallied on news that Pfizer’s new COVID-19 vaccine late-stage trials appear to show 90% effective rates. Overall, this is very good news for the US and global market economic recovery efforts. It means we may be able to get back to somewhat normal very quickly (as soon as the Fast-Track FDA approval process is complete). The YM (Dow Jones E-Mini Futures) reached a high of 30,000 very early today – which is a huge psychological level for traders.
After the US elections last week and the continued news of the outcome – the global financial markets were really wanting some type of good news instead of more chaos and unknowns. The Pfizer news hit the pre-market trading like a booster rocket. Before the opening bell in New York, the Dow Jones futures were up over 1500 points – which is simply incredible.
If you’ve followed my research long enough, you’ve heard me use the term “Pop-n-Drop”. A “Pop-n-Drop” is when something big drives a big market gap which quickly falls down later in the trading session(s). This happend because market prices always have a way of reverting back to somewhat normal trading ranges. Let’s take a look at a few different charts/sectors to help illustrate this type of setup.
First, in these examples, we’re exploring the upside price gap triggered by the Pfizer news this morning. Second, we are going to focus on various major market sectors that represent key elements of the US economy. Lastly, we want our readers to focus on the gaps that are created and what will be needed to potentially “fill” those gaps in the future.
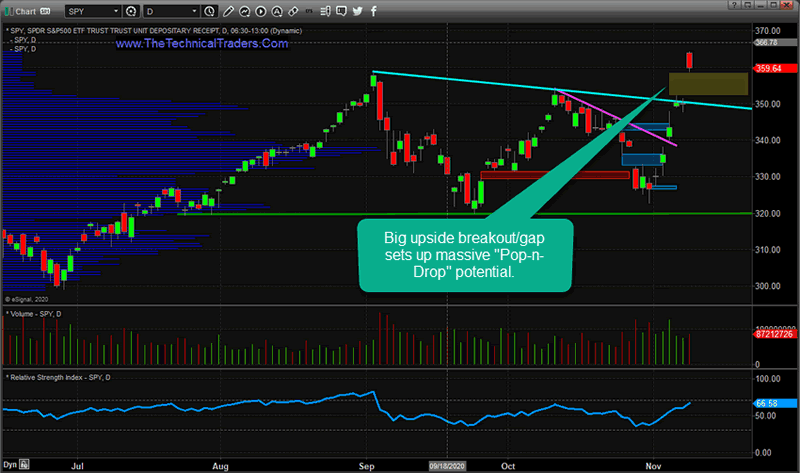
SPY POP-N-DROP SETUP
This first SPY Daily chart highlights the POP with a shaded YELLOW rectangle. You can already see the red bar on the right side of this chart that highlights the downside “drop” that is taking place after this huge upside price gap. The optimism about a vaccine is very real, but the markets sometimes get ahead of themselves in terms of price levels. This is when a “reversion price event” sometimes takes place to allow price to revert back to fair values.
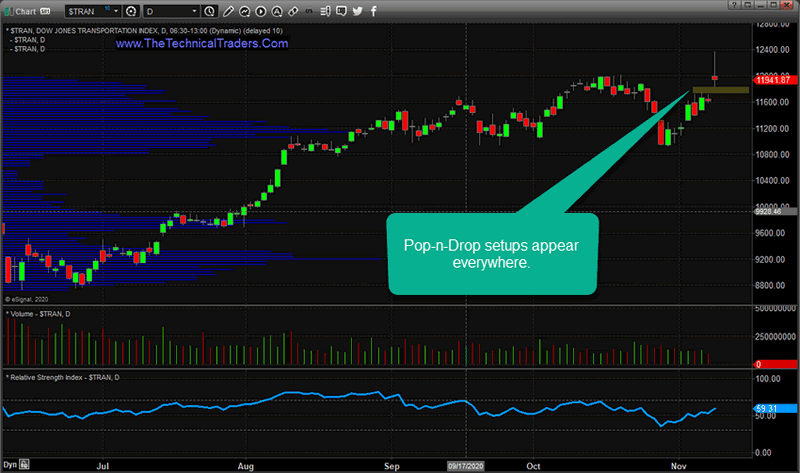
TRAN POP-N-DROP SETUP
This Transportation Index (TRAN) Daily chart highlights a similar setup – yet the Gap range is much smaller. This suggests that traders did not believe the Transportation Index would translate the positive vaccine news as positively as the SPY price Gap did. In other words, the difference between the Gap ranges suggests traders lacked conviction in this trend for the Transportation Index.
Before you continue, be sure to opt-in to our free market trend signals before closing this page, so you don’t miss our next special report!
This relative variance in the conviction of traders may play out as an important factor as Transportation is a key element of the economic recovery. It may suggest that the SPY Gap in price was a bit excessive in terms of timing the outcome of the vaccine. Remember, the FDA still needs to approve this new vaccine and the process of achieving that approval may still be months away. Thus, the big price gap in the SPY vs. the TRAN may be a representation that speculative traders jumped on the good news while the immediate economic benefits are still minimal – as shown on the TRAN chart.
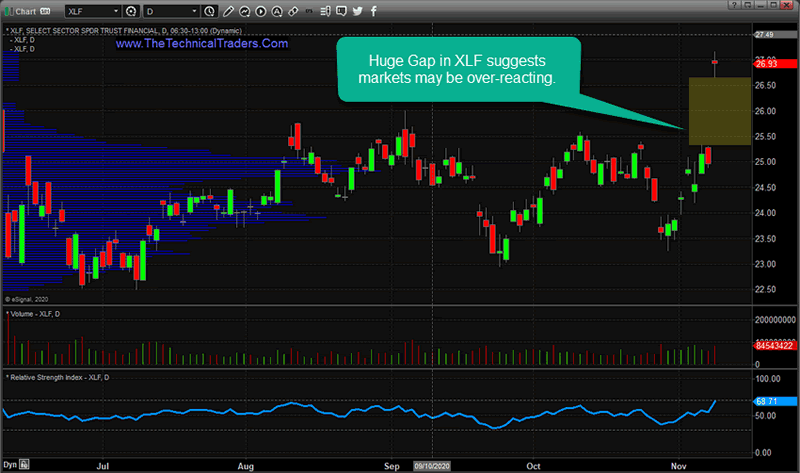
XLF POP-N-DROP SETUP
This XLF chart really represents a big Pop-n-Drop setup. Of course, the financial sector would benefit from anything that helps to move the US/global economy back to normal. Particularly, anything that helps bring consumers back to more normal spending activities. A vaccine that works means more jobs, more paychecks, more consumer spending – just like before COVID-19 hit. So it makes sense that traders would think any vaccine news would be a big benefit for the financial sector.
Yet, the real benefits won’t be seen for many months to come. This big upside price gap on the XLF chart is speculation that the new vaccine will have some positive pricing outcomes. It will. But that positive outcome will come when people really get back to work and consumers start engaging in normal economic activities again.
This big POP higher will likely result in some type of downside price reversion as traders/investors come to terms with the time-horizon of the actual recovery event after the vaccine is approved for general use.
We want to highlight that this type of Pop-n-Drop pattern does not mean the markets are weak or going to collapse. The news today about the Pfizer vaccine is a very positive event. We all want our lives to get back to normal and for COVID-19 to vanish. When price moves aggressively because of some news announcement or other event that creates a big price Gap, that big Gap is often followed by a bit of a price reversion event. It is a natural type of reaction to a big price event.
My research team and I are simply highlighting these examples while showing you how the Pop-n-Drop setup unfolds. We’ll see how well this big upside price gap holds up over the next few weeks and months. Overall, this is a very positive event for the markets. The Dow Jones (YM) rallied up to reach 30,000 very early today – a huge psychological level. We all want to see the global markets regain their strength and recovery more efficiently. This may be the start of settling the COVID-19 concerns and experiencing a real market recovery over time.
Learn how my team and I can help you find and execute better trades. We can help grow your trading account with our Swing Trading service and protect your investment account with our long-term market signals service. Visit www.TheTechnicalTraders.com today to earn more. If you trade options or are looking to learn more about options trading then please click here to sign up for information on the upcoming launch of our new options courses and our new options signals newsletter service.
Chris Vermeulen
www.TheTechnicalTraders.com
Chris Vermeulen has been involved in the markets since 1997 and is the founder of Technical Traders Ltd. He is an internationally recognized technical analyst, trader, and is the author of the book: 7 Steps to Win With Logic
Through years of research, trading and helping individual traders around the world. He learned that many traders have great trading ideas, but they lack one thing, they struggle to execute trades in a systematic way for consistent results. Chris helps educate traders with a three-hour video course that can change your trading results for the better.
His mission is to help his clients boost their trading performance while reducing market exposure and portfolio volatility.
He is a regular speaker on HoweStreet.com, and the FinancialSurvivorNetwork radio shows. Chris was also featured on the cover of AmalgaTrader Magazine, and contributes articles to several leading financial hubs like MarketOracle.co.uk
Disclaimer: Nothing in this report should be construed as a solicitation to buy or sell any securities mentioned. Technical Traders Ltd., its owners and the author of this report are not registered broker-dealers or financial advisors. Before investing in any securities, you should consult with your financial advisor and a registered broker-dealer. Never make an investment based solely on what you read in an online or printed report, including this report, especially if the investment involves a small, thinly-traded company that isn’t well known. Technical Traders Ltd. and the author of this report has been paid by Cardiff Energy Corp. In addition, the author owns shares of Cardiff Energy Corp. and would also benefit from volume and price appreciation of its stock. The information provided here within should not be construed as a financial analysis but rather as an advertisement. The author’s views and opinions regarding the companies featured in reports are his own views and are based on information that he has researched independently and has received, which the author assumes to be reliable. Technical Traders Ltd. and the author of this report do not guarantee the accuracy, completeness, or usefulness of any content of this report, nor its fitness for any particular purpose. Lastly, the author does not guarantee that any of the companies mentioned in the reports will perform as expected, and any comparisons made to other companies may not be valid or come into effect.
Chris Vermeulen Archive |
© 2005-2022 http://www.MarketOracle.co.uk - The Market Oracle is a FREE Daily Financial Markets Analysis & Forecasting online publication.