Stock Market Dow Long-term Trend Analysis
Stock-Markets / Stock Markets 2020 Nov 20, 2020 - 05:32 PM GMTBy: Nadeem_Walayat
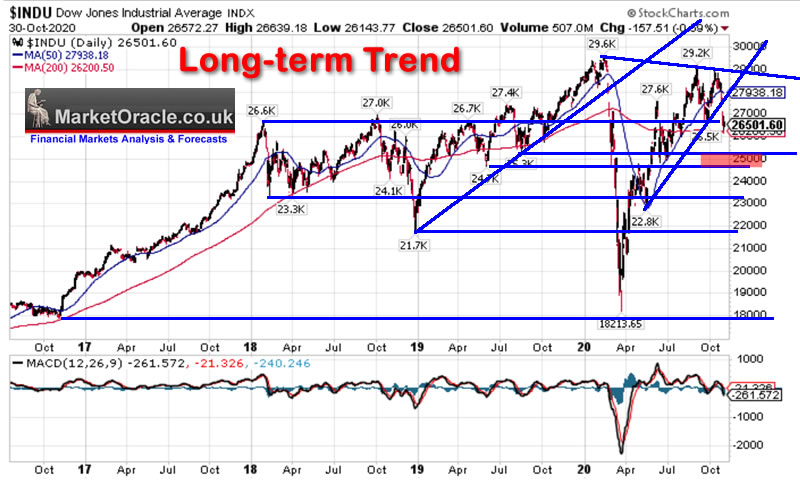
The stock market is having its first significant correction since the start of it's bull run following the corona crash into March 2020. Failure to hold support at 26,500 is eyeing a trend to next support at 25,000. Though MACD is oversold so implies limited downside. Of course price action is heavily influenced by election uncertainty.

TREND ANALYSIS:- The Dow came within a whisker of trading at a new all time high in September before turning lower, this implies to expect a significant correction, i.e. the Dow could retrace as much as 50% of the advance off the March low, though which at this point in time is a low probability outcome.
RESISTANCE: There is heavy overhead resistance art 29,000 to 29,400 which means its going to take several assaults before a breakout to new all time highs, so unlikely this year.
SUPPORT: The Dow has broken immediate support at 26,500 below which is support at 61.8% 25,000 and then 50% at 23,700.
TRENDLINES: The Dow has gapped below trendline support so signals a change in trend i.e. it looks like the bull run is over for now, thus lower prices are more likely than not.
MACD: MACD has unwound its overbought state and is basically neutral, which means that any trend lower should be measured rather than severe.
VIX

VIX is spiking to levels inline with recent spikes so suggests that further downside should be limited, i.e. we may have reached max volatility.
This analysis is an excerpt from my latest in-depth analysis that concludes in a detailed trend forecast for the stock market into January 2021.
Stock Market Trend Forecast into January 2021, Final Election Forecast Matrix
- Stock Market Big Picture
- Dow Short-term Analysis
- Dow Long-term Trend Analysis
- VIX Analysis
- 2020 vs 2016 and 2012
- ELLIOTT WAVES
- Seasonal Trend / Election Cycle
- Dow Stock Market Trend Forecast Conclusion
- US Presidential Election Forecast Matrix Final Update
- AI Stocks - AMD is Killing Intel
So for immediate first access to ALL of my analysis and trend forecasts then do consider becoming a Patron by supporting my work for just $3 per month. https://www.patreon.com/Nadeem_Walayat.
And ensure you are subscribed to my ALWAYS FREE newsletter for my next in-depth analysis.
Nadeem Walayat
Copyright © 2005-2020 Marketoracle.co.uk (Market Oracle Ltd). All rights reserved.
Nadeem Walayat has over 30 years experience of trading derivatives, portfolio management and analysing the financial markets, including one of few who both anticipated and Beat the 1987 Crash. Nadeem's forward looking analysis focuses on UK inflation, economy, interest rates and housing market. He is the author of five ebook's in the The Inflation Mega-Trend and Stocks Stealth Bull Market series that can be downloaded for Free.
 Nadeem is the Editor of The Market Oracle, a FREE Daily Financial Markets Analysis & Forecasting online publication that presents in-depth analysis from over 1000 experienced analysts on a range of views of the probable direction of the financial markets, thus enabling our readers to arrive at an informed opinion on future market direction. http://www.marketoracle.co.uk
Disclaimer: The above is a matter of opinion provided for general information purposes only and is not intended as investment advice. Information and analysis above are derived from sources and utilising methods believed to be reliable, but we cannot accept responsibility for any trading losses you may incur as a result of this analysis. Individuals should consult with their personal financial advisors before engaging in any trading activities.
Nadeem Walayat Archive |
© 2005-2022 http://www.MarketOracle.co.uk - The Market Oracle is a FREE Daily Financial Markets Analysis & Forecasting online publication.


