


Financial Stocks Sector ETF Shows Unique Island Setup – What Next?
Stock-Markets / Banking Stocks Nov 25, 2020 - 02:37 PM GMTBy: Chris_Vermeulen

One would think the Financial Sector would be doing quite well related to the booming housing market and a decline in overall consumer debt and delinquency levels. Historically, the XLF chart shows that $32 is very close to the 2007 peak levels before the collapse that started in late 2007. Currently, the February 2020 highs represent a similar price peak level (near $32), and the current upside price trend has stalled near $27.50, which is a very strong resistance level.
XLF Monthly Double Top Warns Of Strong Resistance Near $32
This Monthly XLF chart below shows over 12 years of historical price data to allow our readers to understand the current market volatility and the current Double Top formation near $32. We’ve also added some trend lines to help you understand the current price channel (CYAN) and the expanding wedge formation (YELLOW) that has setup recently. The historical price channel (CYAN) shows the XLF is trading near the middle of this channel. The expanding wedge setup shows a moderately deep downside price capacity if the financial sector falls into a new bearish price trend.
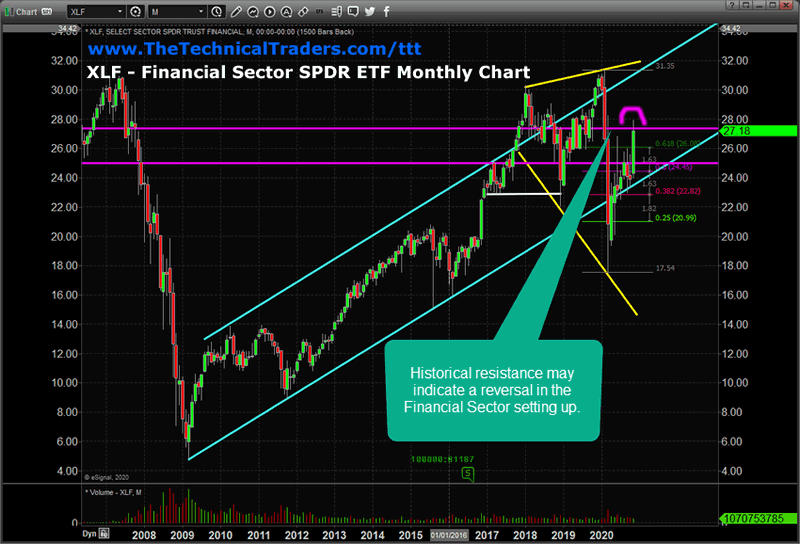
Overall, there are two levels that have the focus of my research team – the $27.40 & $25.05 levels (the horizontal MAGENTA lines). We believe these historical support/resistance continue to play very important roles as price attempts to rally above the $27.40 level right now. If it fails to establish a bullish rally above this level, then the $25.05 level becomes an immediate support level for XLF. Below $25.05, the $21 is the next real support level for XLF before even deeper support is sought out.
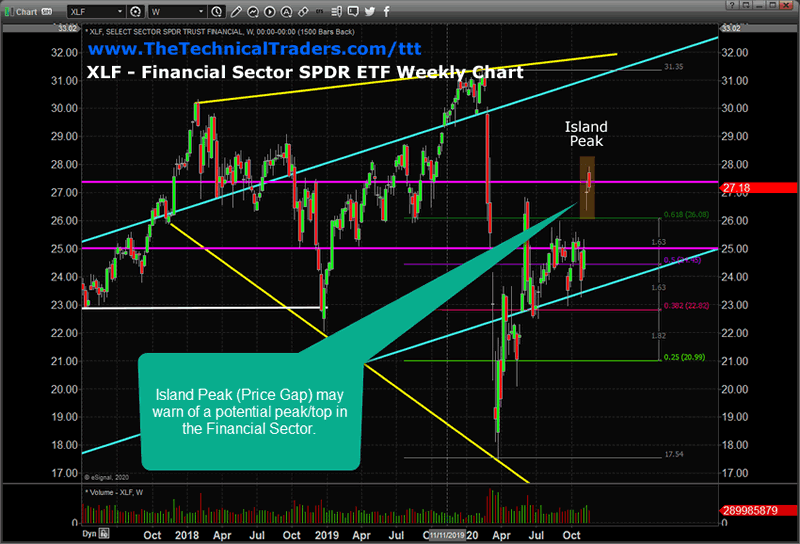
XLF Weekly Upside GAP Shows The Markets Want To Rally
The Weekly XLF chart below highlights the Island Peak in price recently and the huge GAP in price. We believe the $27.40 (the upper MAGENTA line) level must continue to hold as support for this continued upside price trend to rally back above $30. This Island Peak and the Double Top pattern on the Monthly XLF chart suggests the financial sector has already reached a peak price level. As such, price would have to rally above $32 to prompt a new bullish price trend above the Double Top price levels.
Before you continue, be sure to opt-in to our free market trend signals before closing this page, so you don’t miss our next special report!
The US Stock markets continue to stay fairly strong recently with the news of the COVID-19 vaccines and future expectations that the US may soon start to resume more normal activities. We believe the Financial sector may continue to rally higher, but we are still cautious of the current Island Peak setup and the warning from the Double Top pattern on the Monthly chart. We may see some time of a Christmas rally into early 2021, then experience a completely different market cycle depending on the new President and policies.
The financial sector is uniquely exposed to consumer, retail, commercial, and global credit/debt issues. We believe the financial sector is a moderately solid “bell-weather” for traders to help gauge future expectations and opportunities. Currently, the XLF is showing fairly strong potential for upward trending, but big risks are present because of the Island Peak and the huge price gap.
As we move into the 2020 holidays, pay attention to how the markets react to the continued recovery efforts and global banking/policy issues. The Financial Sector could become a very profitable sector for skilled technical traders. We can help you find and identify great trading opportunities so visit www.TheTechnicalTraders.com to learn about my exciting ”Best Asset Now” strategy and indicators. Sign up now for my daily pre-market video reports that walk you through the charts of all the major asset classes every morning.
Enjoy the rest of your Sunday!
Chris Vermeulen
www.TheTechnicalTraders.com
Chris Vermeulen has been involved in the markets since 1997 and is the founder of Technical Traders Ltd. He is an internationally recognized technical analyst, trader, and is the author of the book: 7 Steps to Win With Logic
Through years of research, trading and helping individual traders around the world. He learned that many traders have great trading ideas, but they lack one thing, they struggle to execute trades in a systematic way for consistent results. Chris helps educate traders with a three-hour video course that can change your trading results for the better.
His mission is to help his clients boost their trading performance while reducing market exposure and portfolio volatility.
He is a regular speaker on HoweStreet.com, and the FinancialSurvivorNetwork radio shows. Chris was also featured on the cover of AmalgaTrader Magazine, and contributes articles to several leading financial hubs like MarketOracle.co.uk
Disclaimer: Nothing in this report should be construed as a solicitation to buy or sell any securities mentioned. Technical Traders Ltd., its owners and the author of this report are not registered broker-dealers or financial advisors. Before investing in any securities, you should consult with your financial advisor and a registered broker-dealer. Never make an investment based solely on what you read in an online or printed report, including this report, especially if the investment involves a small, thinly-traded company that isn’t well known. Technical Traders Ltd. and the author of this report has been paid by Cardiff Energy Corp. In addition, the author owns shares of Cardiff Energy Corp. and would also benefit from volume and price appreciation of its stock. The information provided here within should not be construed as a financial analysis but rather as an advertisement. The author’s views and opinions regarding the companies featured in reports are his own views and are based on information that he has researched independently and has received, which the author assumes to be reliable. Technical Traders Ltd. and the author of this report do not guarantee the accuracy, completeness, or usefulness of any content of this report, nor its fitness for any particular purpose. Lastly, the author does not guarantee that any of the companies mentioned in the reports will perform as expected, and any comparisons made to other companies may not be valid or come into effect.
Chris Vermeulen Archive |
© 2005-2022 http://www.MarketOracle.co.uk - The Market Oracle is a FREE Daily Financial Markets Analysis & Forecasting online publication.