


Custom Index Charts Suggest US Stock Market Ready For A Pause
Stock-Markets / Stock Markets 2020 Dec 16, 2020 - 04:03 PM GMTBy: Chris_Vermeulen

Weeks after the Election Rally initiated a moderately strong upside breakout rally, our Custom Index charts suggest the US stock market may be ready for a brief pause in trending before any new trends continue. Global traders and investors jumped into the US stock market just days before the US elections expecting something big to take place. The rally that initiated just days before the US election pushed our Custom Index charts well into the upper range of the 2016 to 2018 upward sloping price channel. This suggests the US stock markets have ended the downward price reversion and are now attempting to extend into the upward price channel – attempting to resume the upward trending that started after the 2016 elections.
weekly smart cash and volatility indexes
The Weekly Smart Cash Index, below, highlights the impressive rally recently and the upward sloping price channel that is back in play for price. The highlighted range of the upward sloping price channel is actually the lower half of the std deviation range of the 2016 to 2018 price channel. So, as of right now, the Smart Cash Index price level has yet to really breach the middle of this channel and is still only within the lower half of the channel. Still, the support near the lower boundary of this level has been retested two or three times over the past six months and held. This suggests the lower channel level (the lower heavy BLUE line) is now acting as moderate price support.
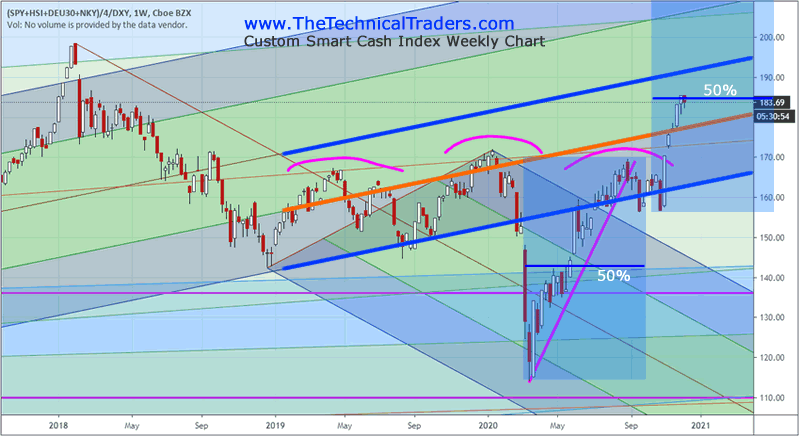
The speed of the recent upside price rally on this Smart Cash Index chart suggests that current price congestion may be an indication that the US stock market has reached a point where it will pause and stall a bit before attempting any new rally. From the recent lows near the end of October to the current highs, the current rally represents a 50% Fibonacci price expansion of the range from the March 2020 lows to the highs in August 2020. The 50% expansion range is a very common Fibonacci level that can typically prompt market price pauses or reversals.
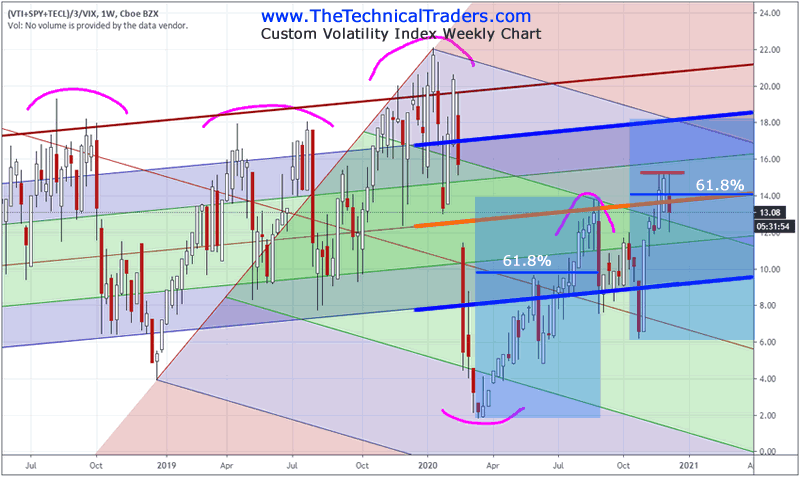
The following Weekly Volatility Index chart highlights a similar pattern – this time referencing the 61.8% Fibonacci price expansion range. The Custom Volatility Index measures broader market trending in relationship to the VIX level. When the VIX level expands (move higher), the Custom Volatility Index tends to decrease dramatically. We can see from this chart that the recovery attempt from the March 2020 lows to the August/September 2020 highs presented a defined upside price range. Applying that range to the current lows that setup just before the US elections shows us that the US stock markets have rallies above the 61.8% Fibonacci price expansion range and contracted back below this level.
Be sure to sign up for our free market trend analysis and signals now so you don’t miss our next special report!
Again, we are still within the 2016 to 2018 upward sloping price channel, so we have seen a very clear resumption of the upward price trend recently. Yet, the Custom Volatility Index chart suggests the US stock markets have reached the middle range of the upward sloping price channel and have reached the 61.8% Fibonacci price expansion range – this is a common area where price will stall, consolidate and/or reverse a bit before attempting to establish any new trends.
If the US stock markets attempt to resume any upside price trending, the RED LINE drawn across recent high price levels, will be the upside target/breach level to watch for. The potential for some type of pause in price or moderate pullback is fairly strong at this level in price. Overall, the trend is still solidly bullish and the lower range of the upward sloping price channel is acting as strong support.
When applying Technical Analysis to current market trends, it is important to understand Fibonacci price structure and how opportunities and risks setup over time. Our Custom Index charts help us visualize how price is reacting to various support and resistance levels as well as help us understand the relationships of price activity to Fibonacci price structure. We believe any pause/pullback in price near current levels will be brief before another upside price trend resumes. The momentum behind the previous rally was quite strong and we don’t believe this momentum will diminish quickly.
Our Best Asset Now (BAN) technology highlighted multiple ETFs that ranked as potentially the best performing assets throughout this rally. Currently, in this extended price rally phase, we are waiting for the BAN technology to confirm a new bullish trend trigger where new ETF symbols may rank highest using our BAN technology. If you want to learn how to identify and trade the Best Assets Now, visit www.TheTechnicalTraders.com to learn more.
Chris Vermeulen
www.TheTechnicalTraders.com
Chris Vermeulen has been involved in the markets since 1997 and is the founder of Technical Traders Ltd. He is an internationally recognized technical analyst, trader, and is the author of the book: 7 Steps to Win With Logic
Through years of research, trading and helping individual traders around the world. He learned that many traders have great trading ideas, but they lack one thing, they struggle to execute trades in a systematic way for consistent results. Chris helps educate traders with a three-hour video course that can change your trading results for the better.
His mission is to help his clients boost their trading performance while reducing market exposure and portfolio volatility.
He is a regular speaker on HoweStreet.com, and the FinancialSurvivorNetwork radio shows. Chris was also featured on the cover of AmalgaTrader Magazine, and contributes articles to several leading financial hubs like MarketOracle.co.uk
Disclaimer: Nothing in this report should be construed as a solicitation to buy or sell any securities mentioned. Technical Traders Ltd., its owners and the author of this report are not registered broker-dealers or financial advisors. Before investing in any securities, you should consult with your financial advisor and a registered broker-dealer. Never make an investment based solely on what you read in an online or printed report, including this report, especially if the investment involves a small, thinly-traded company that isn’t well known. Technical Traders Ltd. and the author of this report has been paid by Cardiff Energy Corp. In addition, the author owns shares of Cardiff Energy Corp. and would also benefit from volume and price appreciation of its stock. The information provided here within should not be construed as a financial analysis but rather as an advertisement. The author’s views and opinions regarding the companies featured in reports are his own views and are based on information that he has researched independently and has received, which the author assumes to be reliable. Technical Traders Ltd. and the author of this report do not guarantee the accuracy, completeness, or usefulness of any content of this report, nor its fitness for any particular purpose. Lastly, the author does not guarantee that any of the companies mentioned in the reports will perform as expected, and any comparisons made to other companies may not be valid or come into effect.
Chris Vermeulen Archive |
© 2005-2022 http://www.MarketOracle.co.uk - The Market Oracle is a FREE Daily Financial Markets Analysis & Forecasting online publication.