Here’s What’s Eating Away at Gold
Commodities / Gold and Silver 2021 Feb 19, 2021 - 06:19 PM GMTBy: P_Radomski_CFA
Gold is dodging bullets, as it comes increasingly under fire from rising U.S. interest rates and a USD that is poised to surge.
Catching unsuspecting traders in yet another bull trap , gold’s early-week strength quickly faded. And with investors unwilling to vouch for the yellow metal for more than a few days, the rush-to-exit mentality highlights a short-term vexation that’s unlikely to subside.
Please see below:
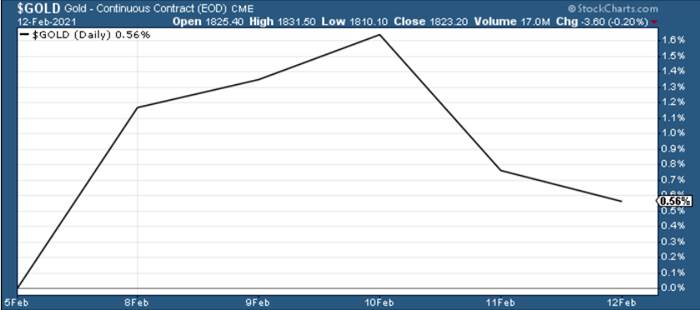
Figure 1
Destined for devaluation after hitting its triangle-vertex-based reversal point (which I warned about previously ), the yellow metal is struggling to climb the ever-growing wall of worry.
Mirroring what we saw at the beginning of the New Year, gold’s triangle-vertex-based reversal point remains a reliable indicator of trend exhaustion.
And when you add the bearish cocktail of rising U.S. interest rates and a potential USD Index surge, $1,700 remains the initial downside target , with $1,500 to even ~$1,350 still possibilities under the right curcumstances.
Please see below:
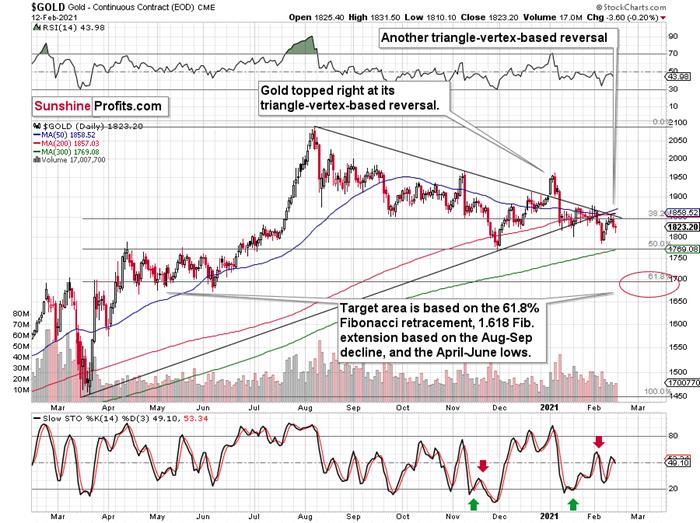
Figure 2 - Gold Continuous Contract Overview and Slow Stochastic Oscillator Chart Comparison
To explain the rationale, I wrote previously:
Back in November, gold’s second decline (second half of the month) was a bit bigger than the initial (first half of the month) slide that was much sharper. The January performance is very similar so far, with the difference being that this month, the initial decline that we saw in the early part of the month was bigger.
This means that if the shape of the price moves continues to be similar, the next short-term move lower could be bigger than what we saw so far in January and bigger than the decline that we saw in the second half of November. This is yet another factor that points to the proximity of $1,700 as the next downside target.
In addition, as a steepening U.S. yield curve enters the equation, I wrote on Jan. 27 that the bottom, and subsequent move higher, in U.S. Treasury yields coincided with a USDX rally 80% of the time since 2003.
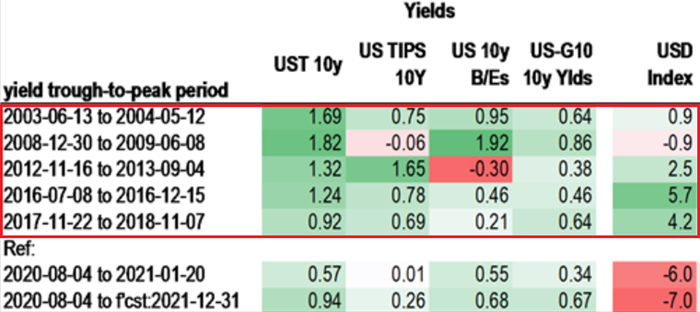
Figure 3 - Source: Daniel Lacalle
And while the USDX continues to fight historical precedent, on Feb. 12, the U.S. 30-Year Treasury yield closed at its highest level in nearly a year. As such, the move should add wind to the USDX’s sails in the coming weeks.
Please see below:
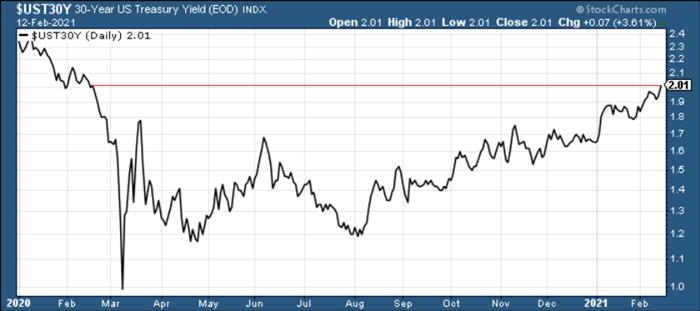
Figure 4
In conclusion, gold is under fire from all angles and dodging bullets has become a near impossible task. With the USD Index likely to bounce off its declining resistance line (now support), a bottom in the greenback could be imminent. Also ominous, a steepening U.S. yield curve signals that the yellow metals’ best days are likely in the rearview. However, as the situation evolves and gold eventually demonstrates continued strength versus the USD Index, its long-term uptrend will resume once again.
Before moving on, I want to reiterate my previous comments and explain why $1,700 remains my initial target:
One of the reasons is the 61.8% Fibonacci retracement based on the recent 2020 rally, and the other is the 1.618 extension of the initial decline. However, there are also more long-term-oriented indications that gold is about to move to $1,700 or lower.
(…) gold recently failed to move above its previous long-term (2011) high. Since history tends to repeat itself, it’s only natural to expect gold to behave as it did during its previous attempt to break above its major long-term high.
And the only similar case is from late 1978 when gold rallied above the previous 1974 high. Let’s take a look at the chart below for details (courtesy of chartsrus.com)
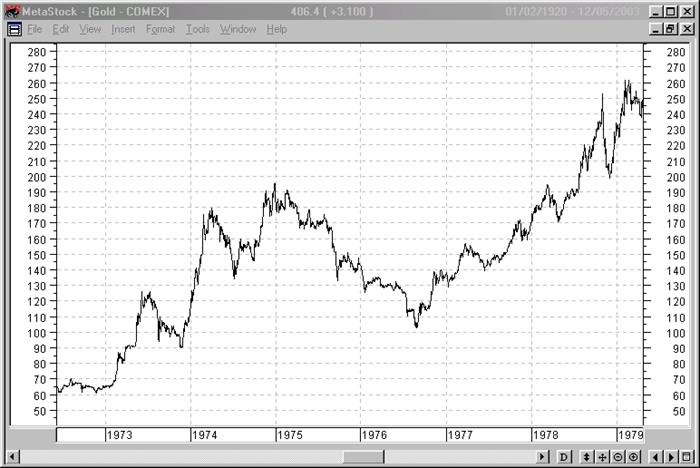
Figure 5 - Gold rallying in 1978, past its 1974 high
As you can see above, in late 1978, gold declined severely right after it moved above the late-1974 high. This time, gold invalidated the breakout, which makes the subsequent decline more likely. And how far did gold decline back in 1978? It declined by about $50, which is about 20% of the starting price. If gold was to drop 20% from its 2020 high, it would slide from $2,089 to about $1,671 .
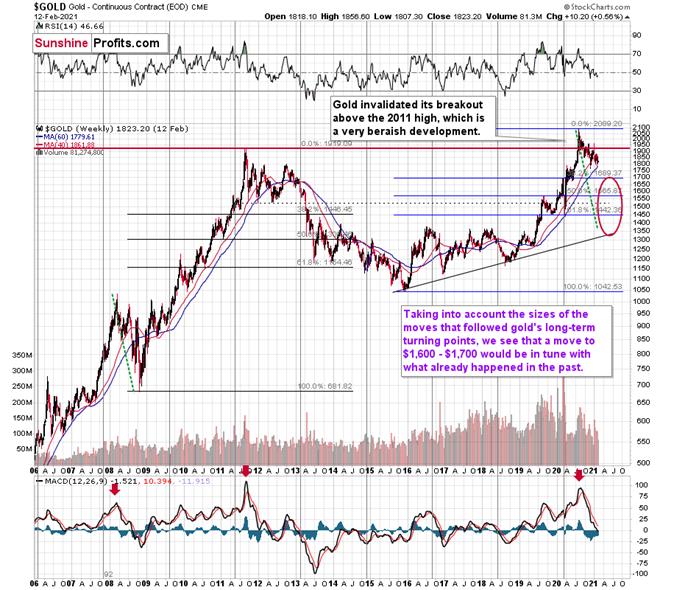
Figure 6 - Relative Strength Index (RSI), GOLD, and Moving Average Convergence Divergence (MACD) Comparison
If you analyze the red arrow in the lower part of the above chart (the weekly MACD sell signal), today’s pattern is similar not only to what we saw in 2011, but also to what we witnessed in 2008. Thus, if similar events unfold – with the S&P 500 falling and the USD Index rising (both seem likely for the following months, even if these moves don’t start right away) – the yellow metal could plunge to below $1,350 or so. The green dashed line shows what would happen gold price, if it was not decline as much as it did in 2008.
However, as of right now, my initial target is $1,700, with $1,500 likely over the medium-term. But as mentioned, if the S&P 500 and the USD Index add ripples to the bearish current, $1,400 (or even ~$1,350) could occur amid the perfect storm. ~$1,500 still remains the most likely downside target for the final bottom, though.
Thank you for reading our free analysis today. Please note that the above is just a small fraction of today’s all-encompassing Gold & Silver Trading Alert. The latter includes multiple premium details such as the targets for gold and mining stocks that could be reached in the next few weeks. If you’d like to read those premium details, we have good news for you. As soon as you sign up for our free gold newsletter, you’ll get a free 7-day no-obligation trial access to our premium Gold & Silver Trading Alerts. It’s really free – sign up today.
Przemyslaw Radomski, CFA
Founder, Editor-in-chief
Tools for Effective Gold & Silver Investments - SunshineProfits.com
Tools für Effektives Gold- und Silber-Investment - SunshineProfits.DE
* * * * *
About Sunshine Profits
Sunshine Profits enables anyone to forecast market changes with a level of accuracy that was once only available to closed-door institutions. It provides free trial access to its best investment tools (including lists of best gold stocks and best silver stocks), proprietary gold & silver indicators, buy & sell signals, weekly newsletter, and more. Seeing is believing.
Disclaimer
All essays, research and information found above represent analyses and opinions of Przemyslaw Radomski, CFA and Sunshine Profits' associates only. As such, it may prove wrong and be a subject to change without notice. Opinions and analyses were based on data available to authors of respective essays at the time of writing. Although the information provided above is based on careful research and sources that are believed to be accurate, Przemyslaw Radomski, CFA and his associates do not guarantee the accuracy or thoroughness of the data or information reported. The opinions published above are neither an offer nor a recommendation to purchase or sell any securities. Mr. Radomski is not a Registered Securities Advisor. By reading Przemyslaw Radomski's, CFA reports you fully agree that he will not be held responsible or liable for any decisions you make regarding any information provided in these reports. Investing, trading and speculation in any financial markets may involve high risk of loss. Przemyslaw Radomski, CFA, Sunshine Profits' employees and affiliates as well as members of their families may have a short or long position in any securities, including those mentioned in any of the reports or essays, and may make additional purchases and/or sales of those securities without notice.
Przemyslaw Radomski Archive |
© 2005-2022 http://www.MarketOracle.co.uk - The Market Oracle is a FREE Daily Financial Markets Analysis & Forecasting online publication.


