


US Debt and Yield Curve (Spread between 2 year and 10 year US bonds)
Interest-Rates / US Debt Feb 24, 2021 - 06:25 PM GMTBy: Nadeem_Walayat

One of the reasons why my analysis of April 2019 was more subdued in terms of the prospects for US house prices than it would otherwise have been is because the yield curve was flirting with inversion, that I concluded that the Fed would not allow to take place and thus adopt whatever measures were necessary to PREVENT inversion that tends to foreshadow lower inflation and recessions.
The Fed succeeded in preventing a sustained inversion during 2019, with the yield curve massaged to hover around 0.2% that is until the pandemic broke and the Fed panicked and opened the monetary flood gates sending the yield curve soaring to currently stand at 1% as the bond market is discounting higher future inflation as the consequence of rampant money printing.
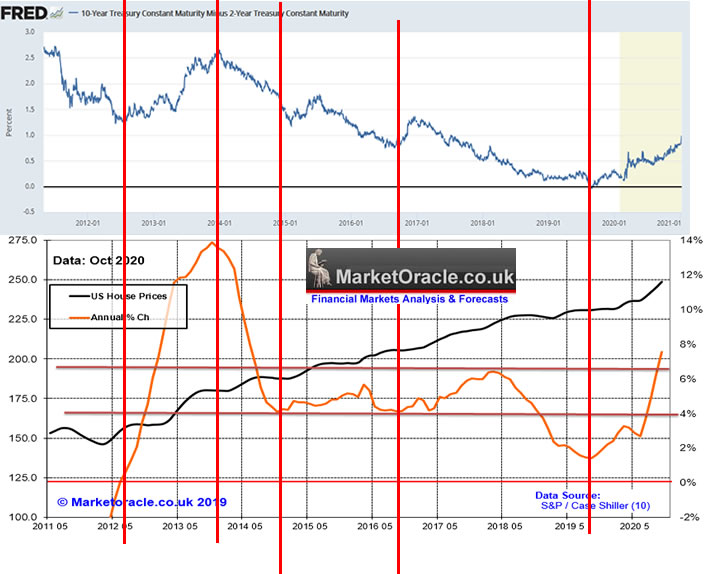
A steep yield curve is signaling FUTURE INFLATION, more money printing stimulus which is good for house prices because basically investors are selling long dated bonds to buy inflation proof assets such as housing. So the yield curve trend is strongly bullish for US house prices.
US Debt
Of all the noise the politicians make the reality is that Democrat or Republicans both are socialists in the practice of deficit spending as the following graph illustrates that if one ignored the Pandemic crash then one would be hard pressed to see the difference between Obama and Trump years.
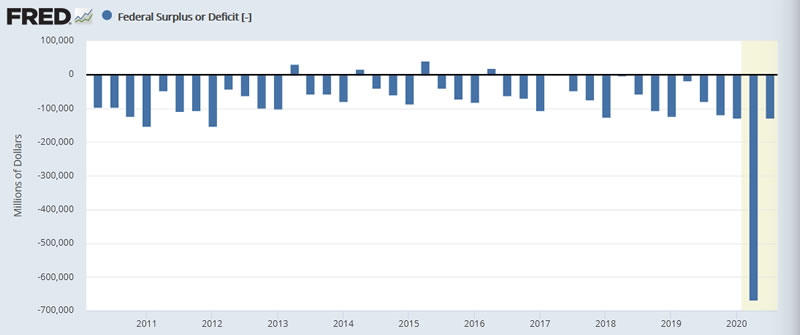
The US debt mountain has now passed £27 trillion, 100% of GDP after adding nearly $4 trillion for 2020!
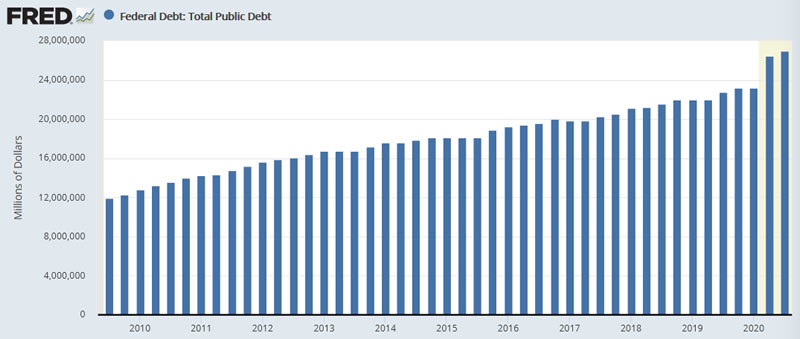
What are the consequences of the US government printing and spending $4 trillion dollars during 2020 and at least another $1.5 trillion during 2021? HIGH REAL INFLATION! So what should you do? Invest in assets such as real estate that cannot be easily printed. Thus in this one graph you have your housing bull market smoking gun. All whilst the perma fools continue to bang the decades long drums of the always imminent debt bubble bursting deflation. All whilst the money printing induced inflation mega-trend continues on it's exponential trend trajectory.
US House Prices Real Estate Trend Forecast Review
Did the perma bears finally get their US house prices crash that they have been crowing so loudly for a decade now?
Firstly a recap of my existing US house prices trend forecast.
30th April 2019 - US House Prices Trend Forecast 2019 to 2021
Therefore my forecast conclusion is for a relatively weak continuation of the US housing bull market into late 2020 at a much shallower pace than experienced in recent years for a likely gain of just 3% over the next 2 years (Jan 2019 to Jan 2021) before entering into a downtrend going into 2021 i.e. Case Shiller 10 city Index (SPCS10RNSA ) rising from 225.9 (Jan 2019 data) to just 232.4 (Jan 2021 data) as illustrated by my trend forecast graph.
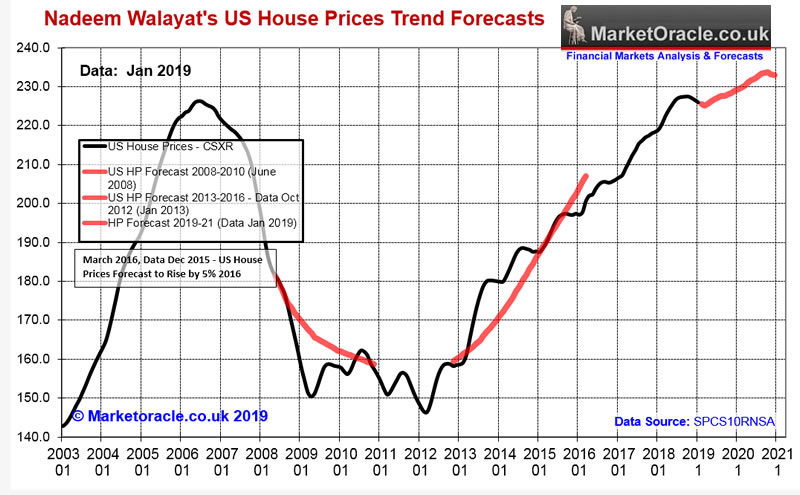
Here is the updated chart for what has transpired since my forecast of April 2019.
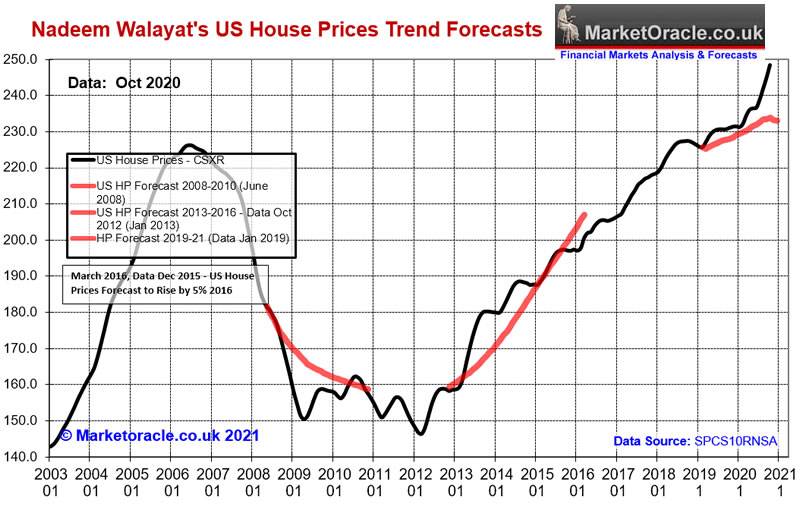
Whilst the US stock market had a panic attack crash into Mid March. The crash where US house prices are concerned was UPWARDS! Which should not come as much of a surprise to those who have been following my analysis for the past 10 years! Money printing, MONEY PRINTING! When you know the Fed is about to print a shit load of money whatever they call it, will mean that assets that cannot be easily printed will surge higher, this IS the INFLATION MEGA-TREND IN ACTION!
The primary mega-trend IS THE INFLATION MEGA-TREND! Those who bet against it on hopes of a repeat of the 1930's depression will keep going BROKE!
This article is an excerpt form my recent extensive in-depth analysis that concludes in a detailed trend forecast for US house prices into 2021.
US Housing Market Trend Forecast 2021, AI Stocks and Coronavirus Pandemic Finale Catastrophe
- UK Coronavirus Catastrophe at Start of 2021
- US Coronavirus Catastrophe at Start of 2021
- US House Prices Trend Forecast Review
- The Inflation Mega-trend QE4EVER
- US House Prices Trend Forecast 2021
- General Artificial Intelligence Was BORN in 2020!
- How AI will come to rule the world
- Intel Fights Back!
- AI Stocks at Start of 2021
The whole of which was first been made available to Patrons who support my work so immediate first access to ALL of my analysis and trend forecasts then do consider becoming a Patron by supporting my work for just $3 per month. https://www.patreon.com/Nadeem_Walayat.
Including my latest which concludes in a detailed stock market trend forecast for 2021 -
Dow Stock Market Trend Forecast 2021
- UK Coronavirus Pandemic Current State
- US Coronavirus Pandemic Current State
- Stock Market Forecasts and Analysis Review of 2020
- The Stock Market Big Picture
- Post Covid Economic Boom
- GAMESTOP MANIA BUBBLE BURSTS
- FED Balance Sheet
- Dow Short-term Analysis
- Dow Long-term Trend Analysis
- ELLIOTT WAVES
- SEASONAL ANALYSIS / Presidential Cycle
- Stocks Bear Market / Crash Indicator (CI18)
- Dow Stock Market 2021 Outlook Forecast Conclusion
Analysis Schedule :
My analysis schedule includes:
- AI Stocks buying levels update
- UK house prices trend forecast
- Bitcoin price trend forecast
- How to Get Rich
- US Dollar and British Pound analysis
* AI Stocks Buying Levels for 2021
After the bonanza of 201 it's time for a significant reorganisation of my AI stocks portfolio for 2021 and beyond.
* UK Housing Market Trend Forecast 2021
Will the UK follow the US inflationary lead or has Brexit and Covid combined to press the pause button on the UK housing bull market for 2021?
* Bitcoin trend forecast 2021
Everyone's now bullish on bitcoin at $50k, well my patrons got to buy it at under $10k!
Last two updates forecast conclusions -
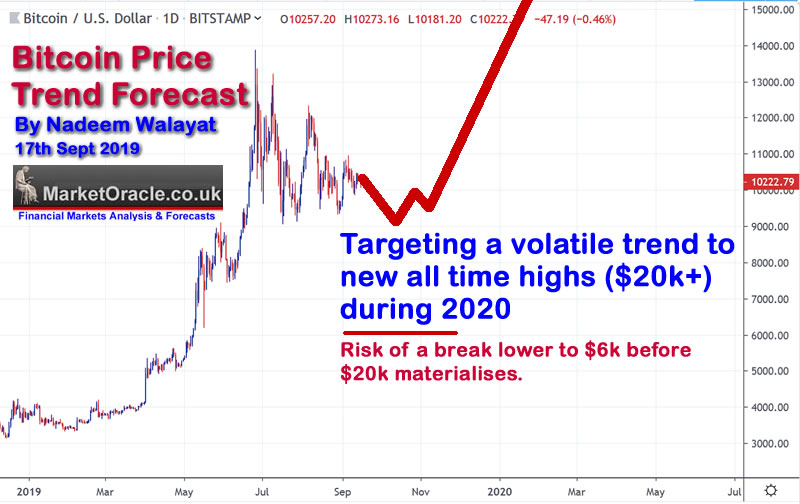
17th Sept 2019 Bitcoin Price Analysis and Trend Forecast
Forecast Conclusion
Therefore my forecast conclusion is for the Bitcoin price to hold support at $9,400 in preparations for an assault on $12k, a break of which would target a break of $14k. However if support at $9.4k fails than Bitcoin could trade down as low as $6k BEFORE heading higher.
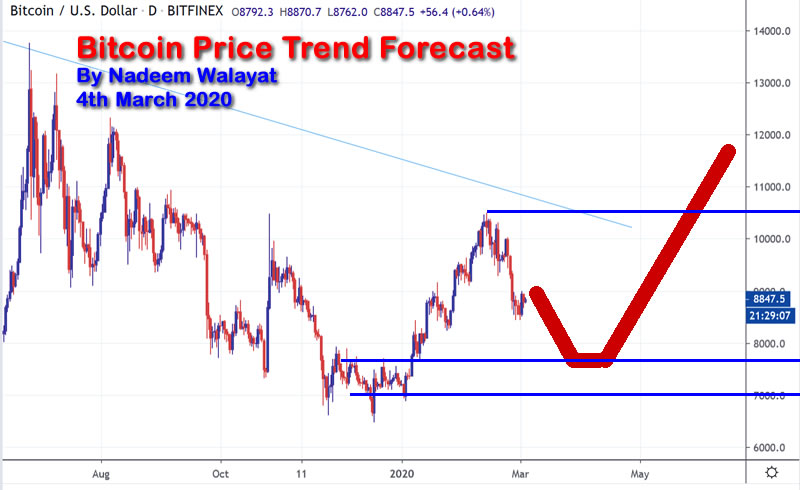
31st March 2020 - Coronavirus Parabolic Pandemic, Bitcoin Price Trend Forecast
Forecast Conclusion
My forecast conclusion is for the Bitcoin price to mark time by trading down to as low as $7,500 before basing for a run higher to resistance of $10,500 that 'should' break to propel the Bitcoin price towards the next resistance level of $12,000. Thus the bitcoin price could drift lower for the next couple of months or so before resuming a bullish trend as illustrated by this chart.
Your analyst wishing all my Patrons a happy and prosperous covid free 2021
And ensure you are subscribed to my ALWAYS FREE newsletter for my next in-depth analysis.
Nadeem Walayat
Copyright © 2005-2020 Marketoracle.co.uk (Market Oracle Ltd). All rights reserved.
Nadeem Walayat has over 30 years experience of trading derivatives, portfolio management and analysing the financial markets, including one of few who both anticipated and Beat the 1987 Crash. Nadeem's forward looking analysis focuses on UK inflation, economy, interest rates and housing market. He is the author of five ebook's in the The Inflation Mega-Trend and Stocks Stealth Bull Market series that can be downloaded for Free.


 Nadeem is the Editor of The Market Oracle, a FREE Daily Financial Markets Analysis & Forecasting online publication that presents in-depth analysis from over 1000 experienced analysts on a range of views of the probable direction of the financial markets, thus enabling our readers to arrive at an informed opinion on future market direction. http://www.marketoracle.co.uk
Disclaimer: The above is a matter of opinion provided for general information purposes only and is not intended as investment advice. Information and analysis above are derived from sources and utilising methods believed to be reliable, but we cannot accept responsibility for any trading losses you may incur as a result of this analysis. Individuals should consult with their personal financial advisors before engaging in any trading activities.
Nadeem Walayat Archive |
© 2005-2022 http://www.MarketOracle.co.uk - The Market Oracle is a FREE Daily Financial Markets Analysis & Forecasting online publication.