


US Bitter Cold Snap is a sign of the times
Politics / Climate Change Mar 08, 2021 - 11:49 AM GMTBy: Richard_Mills

The polar vortex is at it again.
The weather phenomenon responsible for bone-chilling cold fronts settling over parts of North America and Europe, including those that normally experience mild winters, has held much of the central United States in its icy grip the past few weeks.
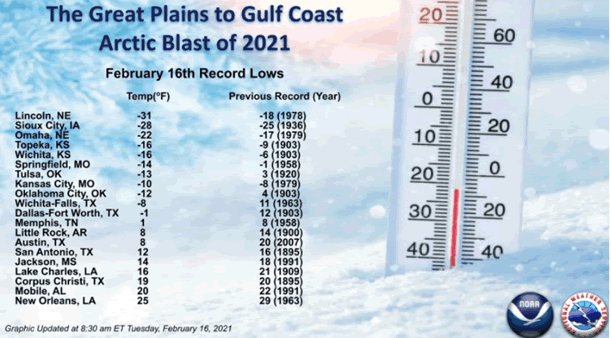
In mid-February, a blob of Arctic air moved as far south as Texas, causing extreme cold and heavy snowfalls, loss of life, traffic chaos and power outages for millions. According to the US National Weather Service, more than 100 million people over a distance of 1.6 million square kilometers were under winter storm warnings. On Feb. 16, some three-quarters of the continental USA was covered in snow, the greatest extent on record in the database which goes back to 2003.
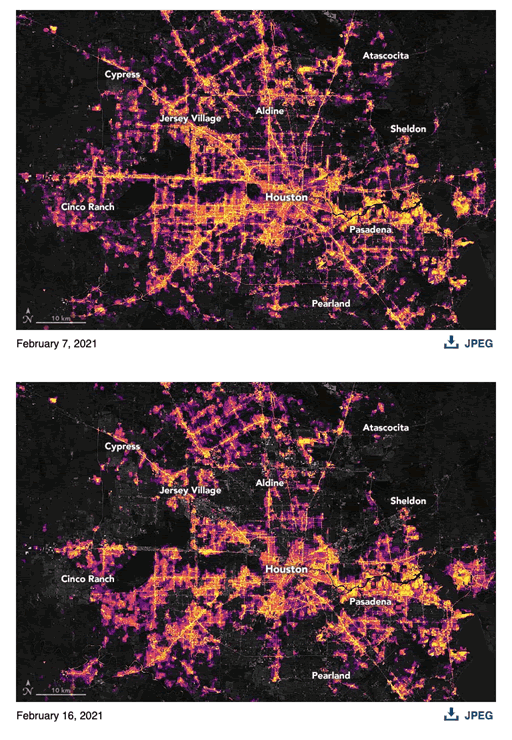
As the mercury plunged to –31F (-37C) in Lincoln, Nebraska and –28 (-33F) in Sioux City, Iowa, parts of Texas were colder than Alaska. Dallas’s 4F (-15C) was the chilliest the city has experienced since 1989, while in Houston, the temperature at the airport fell to 17F, or -18C. A reported 4 million Texans were at one point without power, due to the extreme cold and several snow / ice storms. The two maps below by NASA show Houston and surrounding areas that were plunged into darkness overnight on Feb. 15-16, compared to the week earlier.
Russia and parts of northern and central Europe also saw freezing temperatures. In the week beginning Feb. 8, observation stations in Germany broke monthly records, while in the UK, the coldest night since 1955 came on Feb. 10, with the temperature in Aberdeenshire dipping to –23C. Canals in the Netherlands froze over, while southern Europe and the Mediterranean experienced major snowstorms, including Greece. The white stuff even fell in Syria and Yemen, adding to the misery of populations there.
However unlike in North America, central Europe then experienced a pleasant, though outlier warming trend. According to the World Meterological Association, the city of Gottingen, Germany, saw a massive temperature difference of 41.9 degrees in less than a week, swinging from –23.8C on Feb. 14 to +21C on Feb. 21.
Scientists believe the extreme cold, and sudden warming, are both manifestations of a weaker polar vortex.
Polar vortex
The polar vortex is a seasonal atmospheric phenomenon whereby high winds swirl around an extremely cold pocket of Arctic or Antarctic air. The winds are like a barrier that contains cold air, but when the vortex weakens, the frigid air “escapes” from the vortex and travels south, bringing with it a freezing cold blast of Arctic weather. In 1985, the polar vortex became so distorted that cold air pushed down to Florida, destroying the normally balmy state’s orange crop.
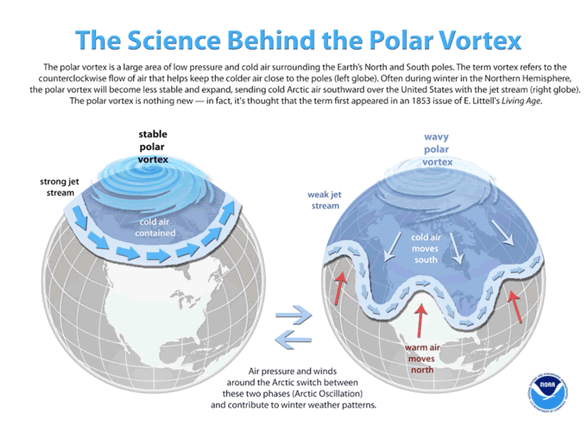
It may sound counterintuitive, but the weakening of the polar vortex is actually due to warming happening in the stratosphere, about 30 km above the North Pole. Called Sudden Stratospheric Warming, this meterological event breaks down the area of low pressure and cold air surrounding the pole, allowing cold air to spill out into the midwestern/ eastern US, and parts of western/ central Canada, and for the warmer air to hang over the Arctic.
How does climate change affect the polar vortex? The answer is warming oceans. As more ice melts during the summer, the Arctic Ocean heats up. The effect is less pronounced in Antarctica because it’s a land form, not a polar ice cap. That heat gets radiated back to the atmosphere in winter, which reduces the intensity of the northern polar vortex winds. The polar vortex gets disrupted, allowing cold air in the center of the swirling cyclone above the pole to migrate south. According to Scientific American, in years when a lot of Arctic sea ice disappeared, the vortex was more likely to weaken.
Along with escaping cold Arctic air that flows into parts of the Northern Hemisphere, a distorted polar vortex also warms polar regions.
In fact, the poles are warming faster than anywhere else on the planet. Canada, where the Arctic makes up 40% of its land mass, is warming at a rate twice as fast as the rest of the world – and will continue to do so.
This is the phenomenon of the “wavering jet stream”. The polar jet stream crosses the North Atlantic from west to east and determines the paths of weather systems. As the Arctic warms, it causes the jet stream to become weaker and wavier, allowing cold polar air to reach further south and warm air to stretch north. This makes weather systems linger in the same locations for longer, such as the 2019 summer hot spell that baked Europe, and the cold snap that froze the eastern and midwestern United States the same year.
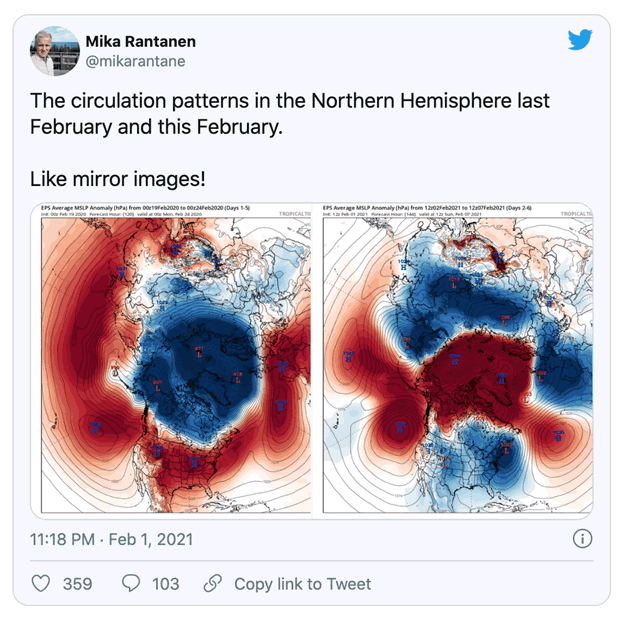
Meteorologists use something called the Arctic Oscillation (AO) index to gauge the extent to which blobs of cold air are held above the Arctic or meander south. A positive AO indicated cold air trapped in the Arctic, where it belongs, versus a negative AO whereby the cold escapes and moves south.
It’s interesting to see the difference between a positive AO in the winter of 2020, which resulted in a mild winter across most of the northern US; and the recent negative AO that brought harsh winter conditions.
The breakdown of the polar vortex and wavering jet stream theory are a good defense of global warming against critics who claim that exceedingly cold winters in certain cities are proof that climate change is not real; in fact, these events are just another manifestation of our changing climate.
Should we expect more of these polar vortex breakdowns? The answer is yes, but the longer-term trend is towards more warming than cooling. The World Meterological Association states that cold waves are becoming more infrequent as a result of climate change, but they will continue to be a part of typical weather patterns in the Northern hemisphere winter.
In its Fifth Assessment Report, the Intergovernmental Panel on Climate Change writes that it is “virtually certain that there will be more frequent hot and fewer cold temperature extremes over most land areas on daily and seasonal timescales as global mean temperatures increase. It is highly likely that heat waves will occur with a higher frequency and duration. Occasional cold winter extremes will continue to occur.”
A study in the Bulletin of the American Meteorological Society found that a weakening polar vortex over the past 40 years, brought on by a melting Arctic, explained 60% of the cooling in Eurasia since 1990. The scary part of all this is the specter of the polar vortex collapsing. This would mean a total disruption of normal atmospheric warming and cooling. Without halos of swirling Arctic and Antarctic winds serving to cool the poles, they would be left to heat up, accelerating global warming.
Forbes writes: What’s concerning is the frequency and duration of breakdowns in the polar vortex, indicating its potential collapse. While the strength of the polar vortex relies on the temperature difference between the mid-latitudes and the Arctic we concurrently see increasing average temperatures in the pole. In addition, NASA puts the rate of declining Arctic sea ice at 13.2% per decade. These signs point to a continued weakening of the polar vortex and a potential collapse.
Melting ice, rising seas
Average global temperatures in 2020 were 1.76 degrees Fahrenheit or 0.98 degrees Celsius warmer than the 1901-2000 base period, according to the National Oceanic and Atmospheric Administration (NOAA). The world just finished the hottest decade on record, with the past six — 2015 to 2020 — the warmest in recorded history.
The warming of the Earth’s surface has caused a widespread retreat of the glaciers at both poles.
The Greenland ice sheet is losing nearly 267 billion metric tons of ice per year. Melting of the continent-sized island started early in 2019 and and reportedly reached historically high levels when warm air from Europe’s heat wave turned ice to water over more than 90% of its surface. Meanwhile Arctic sea ice measured in September – when it is thinnest – is now declining at a rate of 13.2% per decade. The IPCC’s Fifth Assessment Report says Arctic sea ice extent is decreasing by 0.17 million to 0.2 million square miles, every 10 years, about twice the area of Nevada.
In September 2020 Arctic sea ice averaged 3.92 million square kilometers, the second lowest in a 42-year satellite record, behind only September 2012. The ice cover is also thinner, making it more vulnerable to warming air and oceans.
Climate scientists predict if emissions levels continue, summer sea ice will disappear within the next 20 to 25 years.
All of this melting ice has caused sea levels to rise from between seven and eight inches over the last 117 years, NASA states, with the most rise occurring since 1993. Higher sea levels are also caused by the expansion of ocean water as it warms. The latest International Panel on Climate Change report predicts sea levels rising between 20 and 38 inches by 2100 if rising temperatures do not stop. An increase of 65 centimeters, or roughly two feet, is expected to cause significant flooding in coastal cities.
What would happen if the Earth warmed by 3 degrees, just one more degree than currently? According to scientists the effects would be calamitous. With eight out of the 10 largest cities near a coast, several millions would be at risk of flooding, shoreline erosion and storm surges. The worst-hit cities would be in Asia, including Shanghai, Hong Kong and Osaka. Rio de Janeiro, Miami, The Hague, and Alexandria are also included among the most populated, at-risk cities. Climate Central ranked the 25 US cities most at risk of coastal flooding and sea level rise. It found that New York is most likely to have problems, with Miami second. Twenty-two of the 25 cities are in Florida.
One of climate science’s greatest unknowns is what could happen if the Antarctica ice sheet melts. In the 3 degrees scenario, some models predict melting South Pole ice could lift the oceans by a catastrophic 6.5 meters (21 feet). However recent information reveals that changes to the Antarctic ice sheet are not as “linear” as previously thought. Instead, a more detailed model shows that while the rate of ice loss in the South Pole is rapidly accelerating, there are bumps of snowfall and brief reprieves from melt along the way, Science Alert reports.
Thawing permafrost
Along with calving glaciers, shrinking ice caps and disappearing sea ice, evidence of Arctic warming can also be seen in the thawing of permafrost. Permafrost is land that is permanently frozen except for the top layer, which freezes in the winter and thaws in the summer; 70% of Russia sits on permafrost, which in some areas is over a kilometer deep. When it melts, permafrost exposes carbon dioxide and methane, a greenhouse gas that is about 30 times more powerful than CO2, in terms of its ability to trap heat.
This creates a feedback loop, which accelerates warming.
Arctic permafrost in 2017 reached record warm temperatures. It’s estimated that this phenomenon could release between 300 million and 600 million tons of net carbon per year into the atmosphere. Another negative impact of melting permafrost, is subsidence. This is what happens when the surface layer gets deeper and the structures (like houses and industrial buildings) embedded in it start to fail as the ground beneath them expands and contracts.
It had been assumed that the melting of the top layer of tundra that remains frozen year-round would be a slow process, releasing carbon as the ground
thawed. In fact, the permafrost melt is happening much quicker than expected. Scientists studying the phenomenon are finding “Instead of a few centimeters of thaw a year, several meters of soil can destabilize within days. Landscapes collapse into sinkholes. Hillsides slide away to expose deep permafrost that would otherwise have remained insulated,” states CBC.
Climatologists predict that an estimated 2.5 million square miles of permafrost, or 40% of the world’s total, could disappear by the end of this century, significantly accelerating global temperature rise.
Conclusion
The polar vortex is a seasonal atmospheric phenomenon whereby high winds swirl around an extremely cold pocket of Arctic air. The winds are like a barrier that contains the cold air, but when the vortex weakens, the cold air “escapes” and travels south, bringing with it a cold blast of Arctic weather.
The weakening polar vortex, made worse by more warm water allowed to escape into the atmosphere due to thinning Arctic sea ice, leads to enhanced waviness in the polar jet stream.
These waves, called Rossby waves, help to move heat from the tropics toward the poles, and cold air to the tropics, thereby keeping temperatures moderate. When the temperature difference between the higher and lower latitudes is great, the Rossby waves flow in a relatively straight line with little meandering. When the waves meander, causing more pronounced dips and bulges, weather events occur, at the intersection of warm and cold air masses.
The scientific evidence suggests the same phenomenon is likely responsible for extreme heat experienced in Europe in early summer, 2019. The regular pattern of the jet stream changed, resulting in warm, dry air being pulled north from Africa, and settling above Europe.
Climate scientists believe that the overall warming of the planet is more likely to cause warming situations such as the European heat wave. A study done after the 2018 heat wave in the UK, found the probability of a similar event was 30 times more likely than in 1750 when there was less concentration of greenhouse gases in the atmosphere.
The Independent quotes Peter Stott, an expert on climate change and extreme weather, saying that a similar heat wave 100 years ago would have been about 4 degrees cooler, because the baseline temperature was lower. In other words, because Europe’s average temperature has risen about 1.5C over the last century, suddenly adding a warming event makes temperatures spike higher than if the baseline temperature was cooler.
Heat waves therefore are likely to be amplified by a rise in global temperatures, due to heat-trapping greenhouse gases, and occur more often. We should also expect breakdowns in the polar vortex, with blasts of cold air suddenly reaching quite far south, to keep happening, as long as the poles continue to warm, creating wintry weather patterns.
Richard (Rick) Mills
subscribe to my free newsletter
Ahead of the Herd Facebook
Legal Notice / Disclaimer
Ahead of the Herd newsletter, aheadoftheherd.com, hereafter known as AOTH.
Please read the entire Disclaimer carefully before you use this website or read the newsletter. If you do not agree to all the AOTH/Richard Mills Disclaimer, do not access/read this website/newsletter/article, or any of its pages. By reading/using this AOTH/Richard Mills website/newsletter/article, and whether or not you actually read this Disclaimer, you are deemed to have accepted it.
Any AOTH/Richard Mills document is not, and should not be, construed as an offer to sell or the solicitation of an offer to purchase or subscribe for any investment.
AOTH/Richard Mills has based this document on information obtained from sources he believes to be reliable but which has not been independently verified. AOTH/Richard Mills makes no guarantee, representation or warranty and accepts no responsibility or liability as to its accuracy or completeness. Expressions of opinion are those of AOTH/Richard Mills only and are subject to change without notice. AOTH/Richard Mills assumes no warranty, liability or guarantee for the current relevance, correctness or completeness of any information provided within this Report and will not be held liable for the consequence of reliance upon any opinion or statement contained herein or any omission. Furthermore, AOTH/Richard Mills assumes no liability for any direct or indirect loss or damage or, in particular, for lost profit, which you may incur as a result of the use and existence of the information provided within this AOTH/Richard Mills Report.
AOTH/Richard Mills is not a registered broker/financial advisor and does not hold any licenses. These are solely personal thoughts and opinions about finance and/or investments – no information posted on this site is to be considered investment advice or a recommendation to do anything involving finance or money aside from performing your own due diligence and consulting with your personal registered broker/financial advisor. You agree that by reading AOTH/Richard Mills articles, you are acting at your OWN RISK. In no event should AOTH/Richard Mills liable for any direct or indirect trading losses caused by any information contained in AOTH/Richard Mills articles. Information in AOTH/Richard Mills articles is not an offer to sell or a solicitation of an offer to buy any security. AOTH/Richard Mills is not suggesting the transacting of any financial instruments but does suggest consulting your own registered broker/financial advisor with regards to any such transactions
© 2005-2022 http://www.MarketOracle.co.uk - The Market Oracle is a FREE Daily Financial Markets Analysis & Forecasting online publication.