


An Honest Look at Gold’s Chartolgy
Commodities / Gold and Silver 2021 Mar 11, 2021 - 03:33 PM GMT

As you well know the PM complex has been trading at a very important inflection point for the last month or so looking for the next important move either up or down. I can make a case today for either direction but the Chartology is strongly suggesting the next important move is going to be to the downside. In the very short term, days to maybe a week or so we could see some backtesting to many important necklines that have already given way.
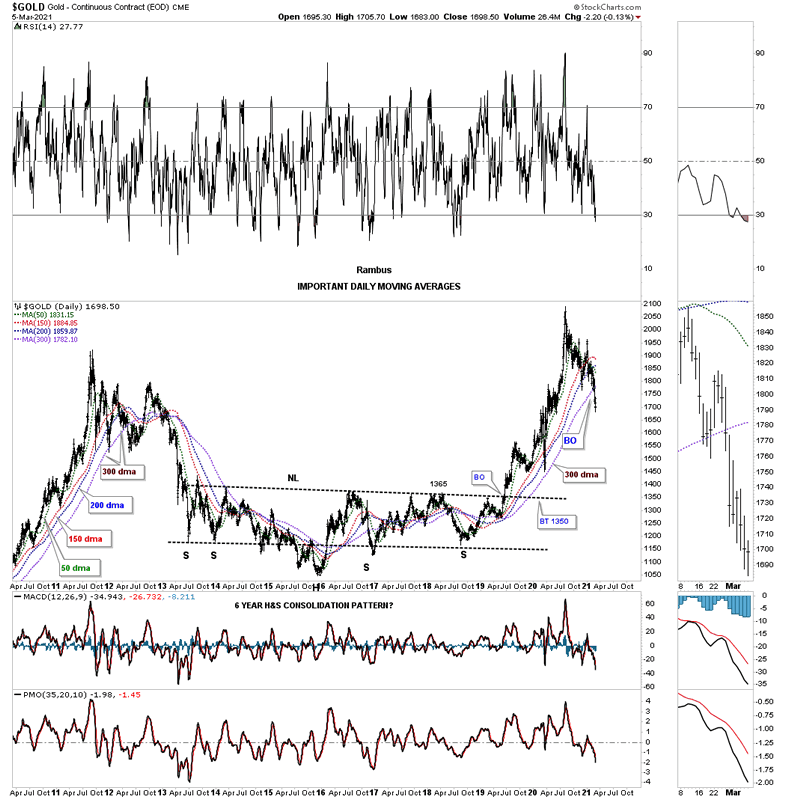
Lets start with a few important moving averages that in the past gave us our first warning that things could start to get a little rough. These aren’t big deals in and of themselves but they do throw up a little red flag that says, pay attention.
During the bull market years I used a ribbon of 4 different moving averages that when they became all properly aligned to the upside they told us that gold was very strong. The 300 day sma was the most important moving average for the long term health of gold. Throughout the bull market that began in 2000 until the high in 2011 the only time the 300 day sma was violated was during the 2008 crash.
Up until last week the ribbon of 4 moving averages had gotten proper aligned just before the H&S bottom neckline was broken to the upside in 2019. As you can see the 300 day sma held support in the spring of 2020 and saved the day for gold. Again, it is not the end of the world but Gold has now traded below its 300 day sma for 7 days in a row now which is allowing the shorter term green 50 day sma to start rolling over along with the red 150 day sma. In a strong bull market it is never a good thing to see these important moving averages rollover especially the longer term moving averages.
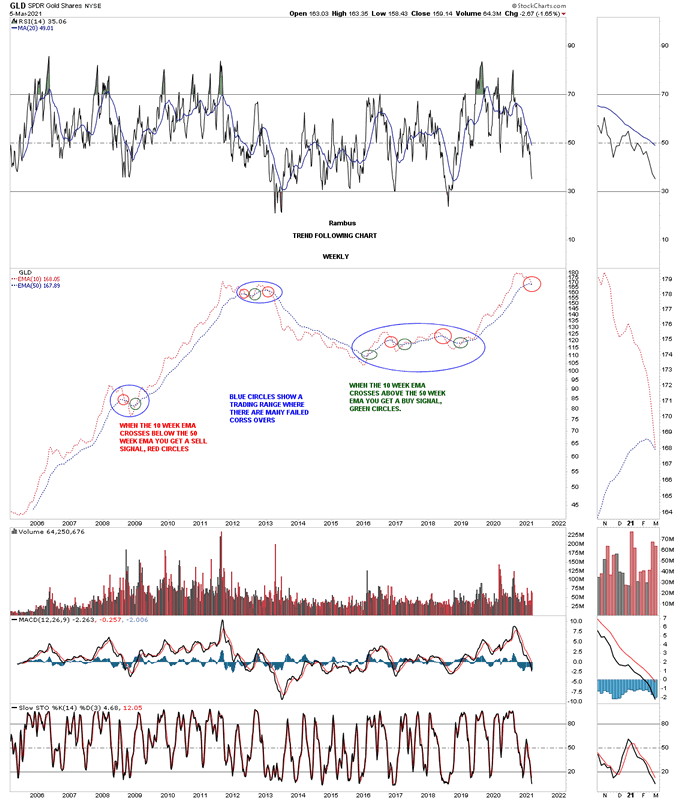
Below is a weekly chart for gold which shows just the 10 and 50 week moving averages without the price of gold. Normally when these 2 moving averages become properly aligned they can keep a buy signal going for years at a time. Normally when you see these two moving averages start crossing back and forth it tells you gold is either building out a reversal pattern or a consolidation pattern. The last buy signal was given back in January of 2019, last green circle. Last week the 10 week closed below the 50 week giving its first sell signal in a little over 2 years, red circle.
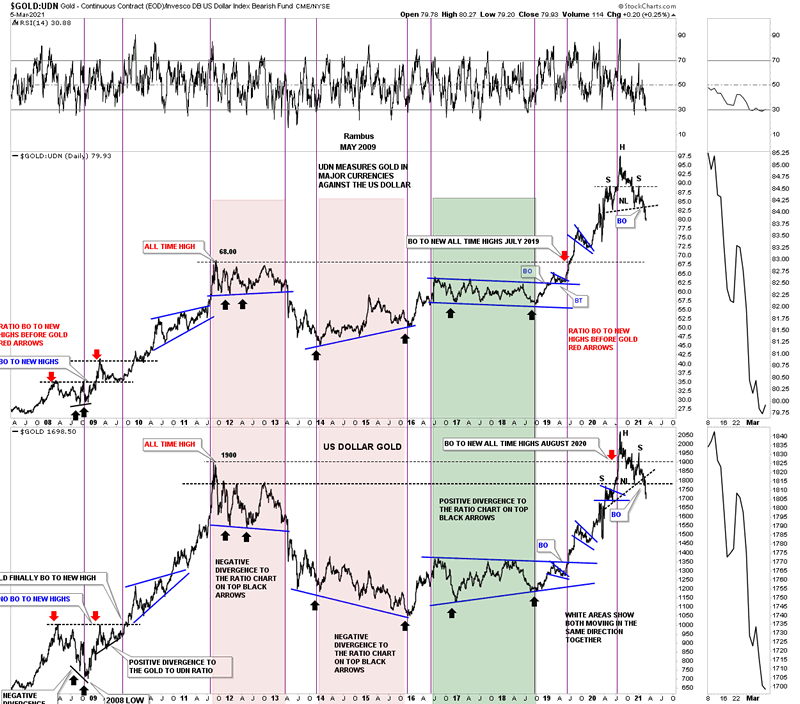
Another important sign that gold may be in trouble is the ratio combo chart we looked at a couple of weeks ago that has the GOLD:UDN ratio on top with gold on the bottom. During a strong bull market these 2 generally move up together, sometimes with the GOLD:UDN ratio which means gold in most of the important currencies of the world leading the way and sometimes gold in US dollar having its turn. If you recall we were looking at the potential H&S top on the GOLD:UDN ratio which has come to fruition. Again, this is not what you want to see during a bull market.
Below is a daily combo chart which has the GOLD:UDN ratio on top with gold on the bottom for a closeup view of the H&S tops on the ratio combo chart above. Since they both have had a backtest shortly after breaking out below their neckline is it possible we will get a 2nd backtest or has the impulse move down already begun in earnest?
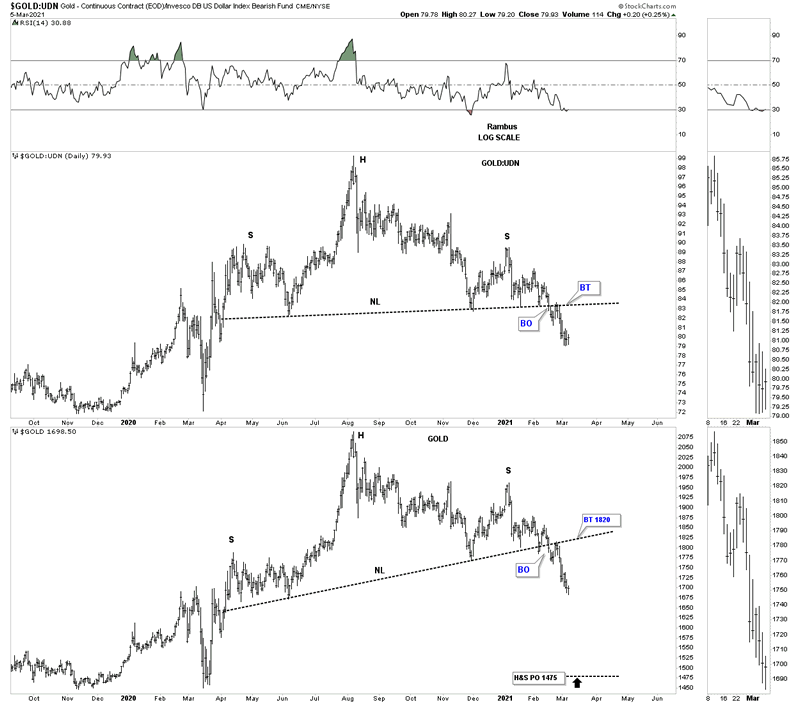
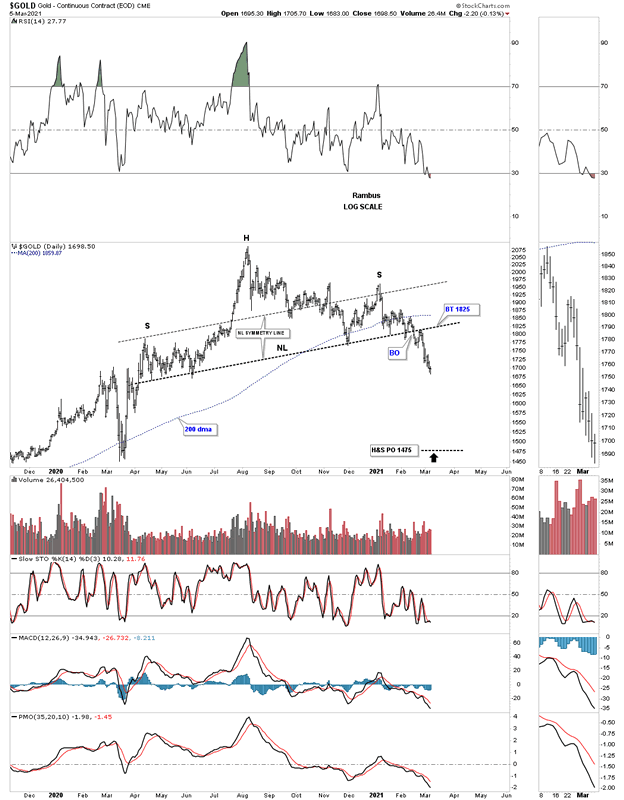
This stand alone chart for gold shows the H&S top price objective down to the 1475 area.
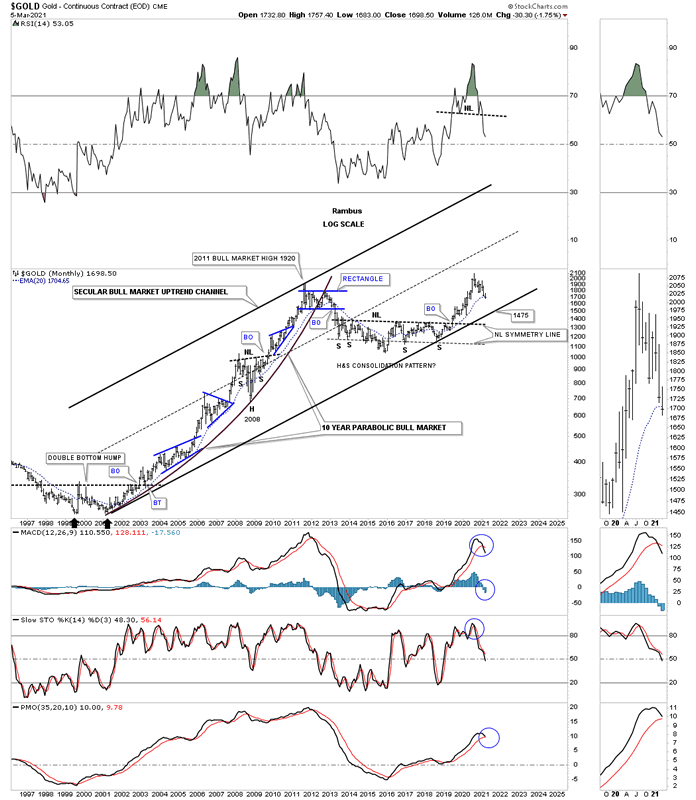
Looking at the long term bull market for gold this 25 year monthly chart shows its secular bull market uptrend channel. This month is far from over yet but gold is starting to trade below its all important 20 month ema which it never broke during the bull market years as shown on the left side of the chart except for the 2008 crash.
The daily chart above showed us a price objective down to the 1475 area which would coincide with the bottom rail of the secular bull market. A move to the bottom trendline wouldn’t be any fun but it wouldn’t hurt the bull market either. Please take a second and study the blue consolidation patterns that formed during the 2000 to 2011 bull market and compare those consolidation patterns to the price action from the all time high made back in August of 2020. Our current trading range is still very small in regards to the size of the bull market. Perspective is everything.
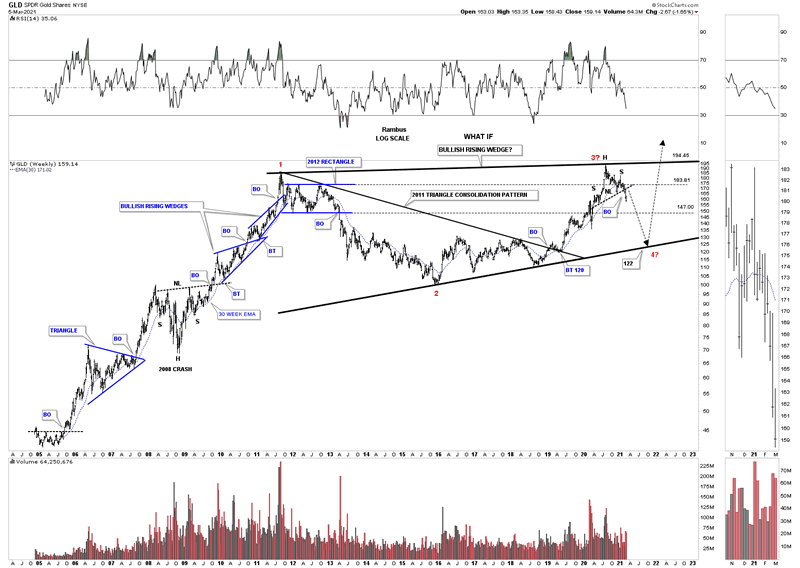
This next chart is a long term weekly look at GLD that I haven’t shown you before. I know you are going to think I’ve lost my mind with this chart but from a Chartology perspective it makes perfect sense now that we are getting more information to work with. We’ve discussed many times in the past how you can find important reversal patterns at the reversal points in big consolidation patterns. The H&S top that we looked at earlier on the daily chart is the same H&S top at reversal point #3.
GLD should have caught support on top of the 2012 blue rectangle around the 183 area but it didn’t hold. GLD then should have found support above the 30 week ema which has now turned down. The next area of support will be at the bottom rail of the 2012 rectangle around the 147 area. There is no law that says GLD has to trade all the way down to the bottom rail of what I’m calling a bullish rising wedge which would end up being a much bigger 2011 bullish rising wedge consolidation pattern in the secular bull market. If that is going to be the case then we have to put in the all important 4th reversal points which I’m showing as a red four. Keep in mind we have a H&S top reversal pattern in place that has reversed the 2018 impulse move from up to down. The odds are high we will see some type of reversal pattern form when this impulse move to the downside completes.
Know that I take no joy in trying to show you an honest view of Chartology. I have to keep things real no matter what the cost. This is just part 1 with 2 more parts to go before I make my case for a bigger consolidation phase we have been in since August of 2020. I will have Part 2 tomorrow night on the PM stock indexes.
All the best
By Rambus Chartology
FREE TRIAL - http://rambus1.com/?page_id=10
© 2021 Copyright Rambus- All Rights Reserved
Disclaimer: The above is a matter of opinion provided for general information purposes only and is not intended as investment advice. Information and analysis above are derived from sources and utilising methods believed to be reliable, but we cannot accept responsibility for any losses you may incur as a result of this analysis. Individuals should consult with their personal financial advisors.
© 2005-2022 http://www.MarketOracle.co.uk - The Market Oracle is a FREE Daily Financial Markets Analysis & Forecasting online publication.