


Gold Extremely Bearish Heading for New Lows
Commodities / Gold & Silver Oct 19, 2008 - 01:56 PM GMTBy: Merv_Burak

 It's been down hill all week with only Wednesday providing a minor bit of relief. It looks like we might be heading for new lows as early as this coming week. Never a dull moment.
GOLD : LONG TERM
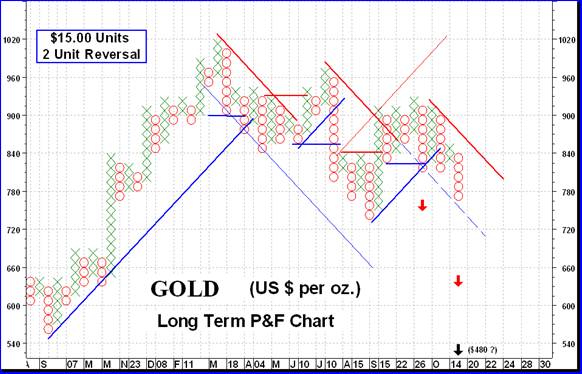
In my many years of researching the markets I recall a wise concept. If after a significant advance the market goes sideways and can't make up its mind which way to continue, the odds are that you have reached a top and the eventual direction will be downward. The opposite is true after a significant decline. Just going sideways was not the criteria as markets often go sideways after a significant move. What the action has to do is give direction changes that go nowhere before being reversed. This is what we have here. Gold had been in a significant up trend before reaching a top and then going into a sideways trend. During the trend we had on the P&F chart a bear signal, followed by a bull signal, followed by a bear signal, followed by a bull signal and now another bear signal. This is a very unusual activity on this long term P&F chart. So, from that concept we are in for a significantly more downside move. The projections presently are to $750, then to $630 with a further projection to $480 should the down trend really continue. No concept is perfect so we'll just have to wait and see how this turns out.
From the long term stand point the indicators are not positive. Gold is below its negative sloping long term moving average line while the momentum indicator remains in its negative zone below its negative trigger line. The volume indicator is well below its negative trigger line. Long term gold can only be rated as BEARISH .
INTERMEDIATE TERM
On the intermediate term things are no better. Although gold has been tracking a somewhat lateral path for a few weeks it has now broken decisively to the down side and is once more heading lower. It is below its now negative sloping moving average line. The momentum indicator has also moved into its negative zone below its negative sloping trigger line. As for the volume indicator, well that indicator is still moving sideways (although I do not have the volume data for Friday which might push it lower) and is sitting right on top of its trigger line. The trigger itself is sloping slightly to the down side. All in all there is nothing here to grab on to and seem bullish. Gold, on the intermediate term, can only be rated as BEARISH .
SHORT TERM
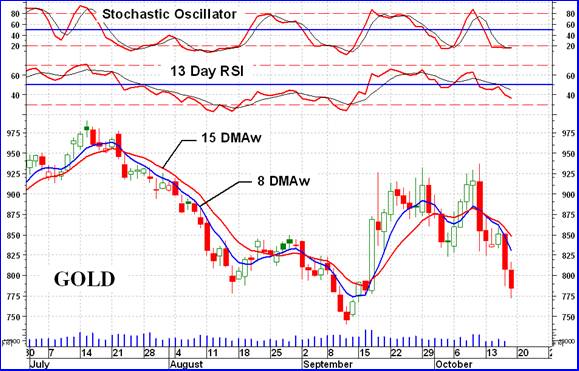
Other than Wednesday it was a lousy week for gold. Gold is quickly moving away from its short term negative moving average line and the momentum indicator is moving deeper inside its negative zone. The daily volume action is low and not giving us any specific message at this time. Finally, the very short term moving average line remains below the short term line indicating that the down side prevails. The only rating one can give the short term with these indicators is a BEARISH rating.
As for the immediate direction of least resistance, well as you might expect that is to the down side. The Stochastic Oscillator has been somewhat neutral in its actions over the past few days but still inside its oversold zone deep in the negative zone.
SILVER
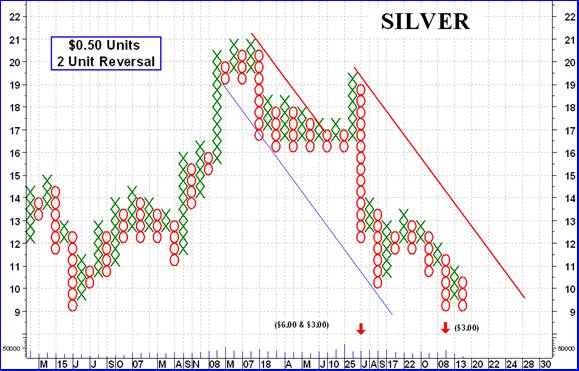
P&F charts are quite versatile. Depending upon the units used and the number of unit reversals required for a change in direction on the chart will depend upon the message of the chart. They all would show the same basic price direction but it is in the potential projections for the move where the differences show up. In my 19 Sept 2008 commentary I showed a P&F chart of silver based upon $0.25 units and 3 unit reversal. On that chart I showed projections to $9.00 and $7.75. The $9.00 has basically been met with the low of Friday being $9.09. Filtering out more of the daily fluctuations by going to higher unit values I get some different projections. Here I use a $0.50 units, 2 unit reversal chart. Projections I get here are to the $6.00 level and two projections to the $3.00 level. The $6.00 is actually an average of two projections, one to $5.50 and one to $6.50. It's the $3.00 one that bothers me. With the projection value reached on two different occasions one must then take this projection seriously. It looks like a long way away and does look overdone. My long term silver chart (data) goes back to 1967 and the lowest price over that time period was the $3.50 price in 1991 and 1993. This silver bull market started in late 2001 from the $4.00 level. Maybe we will just go back to the previous lows but that's something to keep in mind.
The chart shows silver as already breaking below its recent lows (which gold has not yet done) and is at the previous support from mid-2006. How long it will hold at this level is unknown but the previous support level is a very weak one. The trend is towards lower levels and I would not be surprised to see the price reach the next projection at $7.50 very soon.
PRECIOUS METAL STOCKS
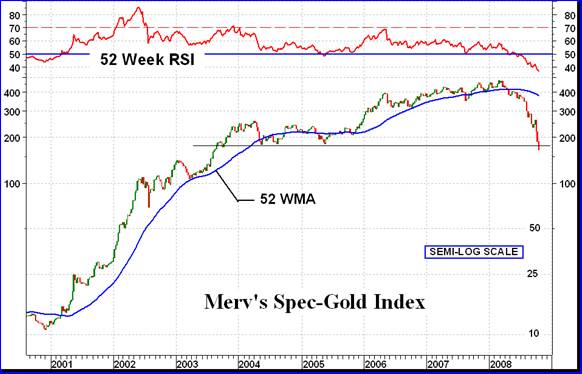
Over the past few weeks I have shown a chart of the average performance of the precious metals universe (Merv's Gold & Silver 160 Index). The components of this universe include the top 100 stocks traded on the North American markets based upon market value, plus 60 others of varying quality. It is updated periodically. I had also shown a chart of the average performance of the 30 largest stocks traded on the North American markets (Merv's Qual-Gold Index). Today I show the next level of stocks, some might call them the second tier stocks. The Merv's Spec-Gold Index presents the average performance of the next 30 largest stocks traded on the North American markets after those included in the Qual-Gold Index.
Comparing the Qual-Gold Index (shown in my commentary of 03 Oct 2008 ) and the Spec-Gold Index is like comparing apples and oranges. Although the two performances look the same the actual % change in the Indices is vastly different. The Qual-Gold increased about 8 times in value from the start of the bull to its top in early 2008. The Spec-Gold, on the other hand, increased by a factor of over 42 times in the same period. One wonders why rush into “quality” when semi-quality gives you such a much greater performance? An interesting point when viewing the two Indices is that the big difference in their performances was during the early years of the bull. The past few years they both seemed to have performed about equal. Whether this phenomena will repeat during the nest bull market remains to be seen, but it is interesting. Where all this will end before the next bull is also something that is difficult to assess ahead of time, but one can quickly assess that a new bull has started by the use of appropriate technical indicators. The chart shown reflects a very long term view. Shorter term indicators would reflect a shorter term outlook but with correspondingly greater potential for whip-saws in movement.
Merv's Precious Metals Indices Table
Let's call it another week.
By Merv Burak, CMT
Hudson Aero/Systems Inc.
Technical Information Group
for Merv's Precious Metals Central
For DAILY Uranium stock commentary and WEEKLY Uranium market update check out my new Technically Uranium with Merv blog at http://techuranium.blogspot.com .
During the day Merv practices his engineering profession as a Consulting Aerospace Engineer. Once the sun goes down and night descends upon the earth Merv dons his other hat as a Chartered Market Technician ( CMT ) and tries to decipher what's going on in the securities markets. As an underground surveyor in the gold mines of Canada 's Northwest Territories in his youth, Merv has a soft spot for the gold industry and has developed several Gold Indices reflecting different aspects of the industry. As a basically lazy individual Merv's driving focus is to KEEP IT SIMPLE .
To find out more about Merv's various Gold Indices and component stocks, please visit http://preciousmetalscentral.com . There you will find samples of the Indices and their component stocks plus other publications of interest to gold investors.
Before you invest, Always check your market timing with a Qualified Professional Market Technician
Merv Burak Archive |
© 2005-2022 http://www.MarketOracle.co.uk - The Market Oracle is a FREE Daily Financial Markets Analysis & Forecasting online publication.