


A Climbing USDX Means Gold Investors Should Care
Commodities / Gold and Silver 2021 Apr 01, 2021 - 03:50 PM GMTBy: P_Radomski_CFA

Positions in the USDX are shifting from shorts to longs, so gold investors should look closely. Why? Because it’s an inverse relationship.
We’ve discussed the negative correlation between the dollar and the precious metals many times before, but it can never be discussed enough, particularly as the situation develops and the outlook for the USD Index becomes more positive.
Once the USD Index lands some knockout punches, the precious metals will be hurting, as they tend to do when the dollar rises. Gold, silver and the miners will eventually rise, but for the medium-term, they are still in bearish territory.
Counted out, counted down and rarely counted on, investors threw in the USD Index’s towel long before the fight even began. However, after shaking the cobwebs and landing a few haymakers, the greenback’s Rocky-like comeback is proof that ‘it ain’t over till it’s over.’
Let’s look at the factors influencing rise of the USD Index as well as some of the historical patterns:
1. Repositioning from Short to Long
Now, with thousands of screaming fans chanting “USD, USD,” the eye of the tiger could be eying another move higher. As evidence, if you analyze the chart below, you can see that non-commercial (speculative) traders have quietly repositioned from net-short to net-long.
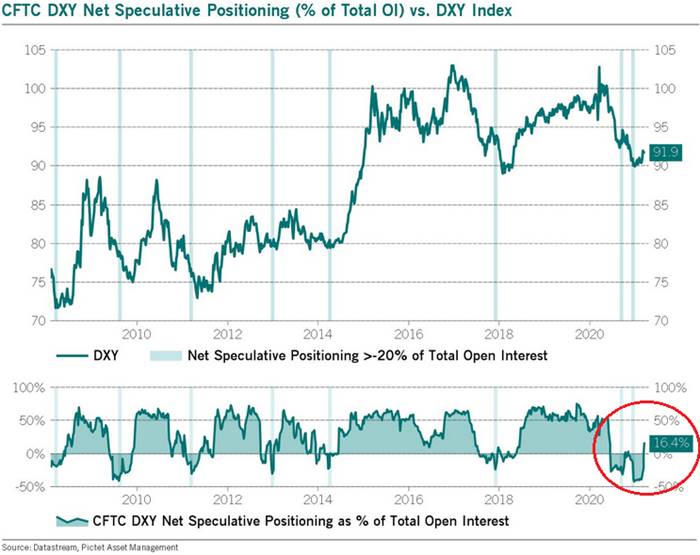
To explain, notice how oversold periods in 2014 and 2018 – where net-speculative short interest as a percentage of total open interest was extremely high – preceded sharp rallies in the USD Index? Thus, with 2021 the most extreme on record, the forthcoming rally should be significant.
How significant? Well, let’s take a look at how things developed in the past – after all, history tends to rhyme.
Let’s focus on what happened when the net speculative positions were significantly (!) negative and then they became significantly (!) positive, so without paying attention to tiny moves (like the one that we saw last summer), let’s focus on the more meaningful ones (like the one that we see right now – the net positions just became visibly positive – over 16%, after being very negative for quite some time.
In short, that’s how the following profound rallies started:
- The big 2008 rally (over 16 index points)
- The big 2009 – 2010 rally (over 14 index points)
- The 2011 – 2012 rally (over 11 index points)
- The 2013 rally (“only” over 5 index points)
- The big 2014 – 2015 rally (over 20 index points)
- The 2018 rally (over 15 index points)
The current rally started at about 89, so if the “normal” (the above shows what is the normal course of action) happens, the USD Index is likely to rally to at least 94, but since the 5-index point rally seems to be the data outlier, it might be better to base the target on the remaining 5 cases. Consequently, one could expect the USD Index to rally by at least 11 – 20 index points, based on the net speculative positions alone. This means the upside target area of about 105 – 114.
Consequently, a comeback to the 2020 highs is not only very likely, but also the conservative scenario.
2. The 10-Year Treasury Yield
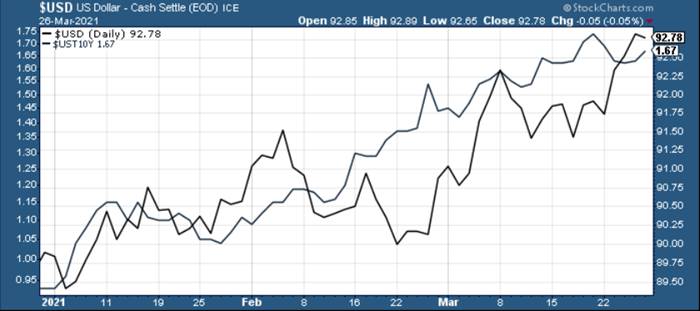
Adding to the momentum, in 2020, the USD Index sat out the U.S. 10-Year Treasury yield’s ferocious upswing. Defying historical precedent, a bottom and subsequent move higher in the U.S. 10-Year Treasury yield has coincided with a rise in the USD Index 80% of the time since 2003 . But now in sync, 2021 has been a much different story. If you analyze the chart below, you can see that the USD Index has been moving in lockstep with the U.S. 10-Year Treasury yield since the New Year.
3. Reclaiming 200-Day Moving Average
In addition, not only has the USD Index broke above its previous highs, but the basket just reclaimed its 200-day moving average (which is often indicative of a long-term uptrend). As a result, the greenback continues to float like a butterfly and sting like a bee .
For historical context, after recapturing its 200-day MA in 2018, the USD Index only suffered mild pullbacks before surging above 95. As such, with the mid-2020 highs the USD Index’s next opponent, 94.5 is unlikely to put up much of a fight.
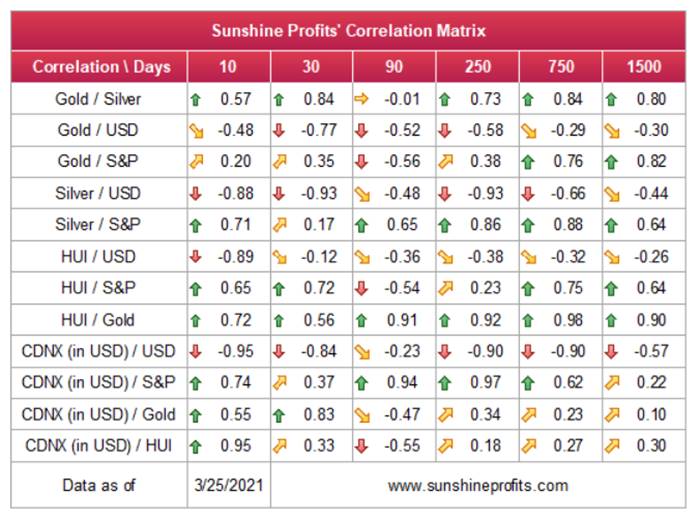
Keep in mind though: in the very-short term, the USD Index could move lower and retest its prior 2021 highs. However, the damage should be minimal, and it wouldn’t invalidate the USD Index’s medium-term breakout. Because of this, the outlook remains profoundly bearish for the gold, silver , and mining stocks over the medium term. If you analyze the table below, you can see that the precious metals tend to move inversely to the U.S. dollar.
4. The History Really Rhymes: The 2017-2018 Upswing
But saving the best for last, the 2017-2018 analogue could be the USD Index’s knockout punch. With this version likely to be titled “The Resurgence: Part 2,” while history often rhymes, it’s rare for it to rhyme with this level of specificity .
Please see below:
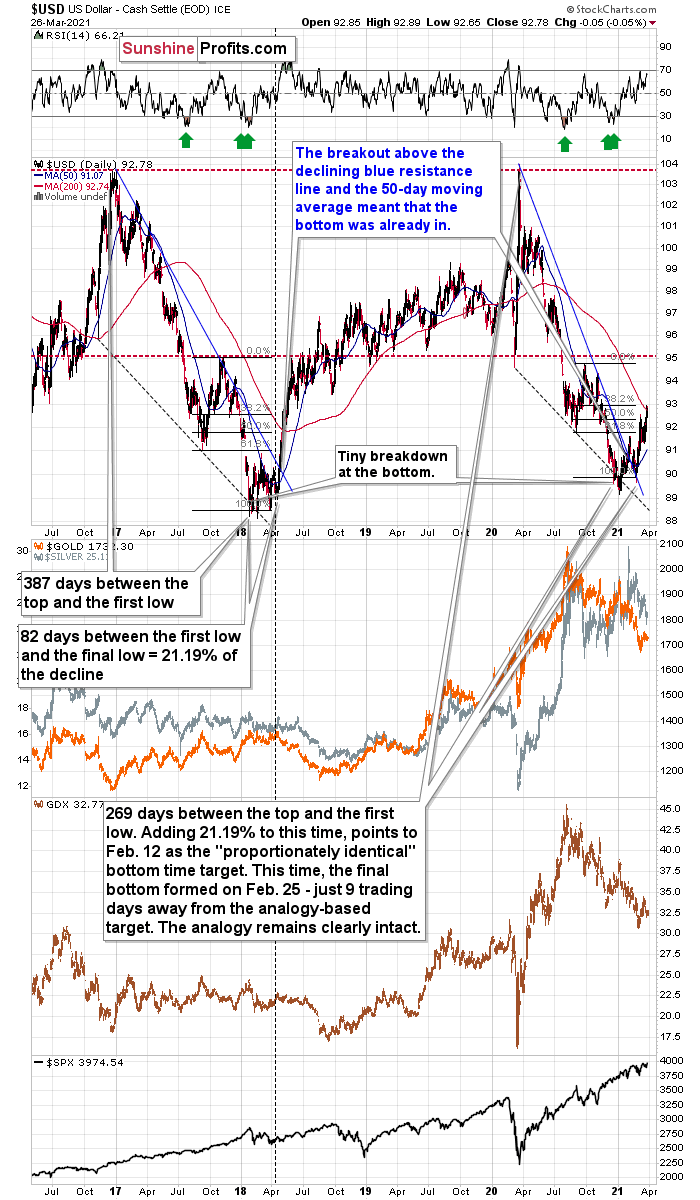
Even more revealing, while it took less than 118 days for the USD Index to move from peak to trough in 2020-2021, the uprising could occur at a much faster pace. In 2018, the USD Index’s breakout above its 50-day moving average is exactly what added gasoline to the USDX’s 2018 fire. And after the 2018 breakout, the USDX surged back to its previous high. Today, that level is 94.5 .
Furthermore, in 2017-2018, it also took 82 days for the USDX to form a final bottom (the number of days between the initial bottom and the final bottom) and the duration amounts to 21.19% of the overall timeframe. If we applied a similar timeframe to today’s move, then the USD Index should have bottomed on Feb. 12. It actually bottomed (finally) on Feb. 25, which was just 8 trading days away from the former date. Taking into account the sizes of the moves that preceded the previous declines (they took approximately one year to complete), this is extremely close and an excellent confirmation that the self-similar pattern remains intact.
Also noteworthy, as the USDX approached its final bottom in 2017-2018, gold traded sideways. Today, however, gold has been in a downward spiral and it doesn’t seem that the decline is over. From a medium-term perspective, the yellow metal’s behavior is actually more bearish than it was in 2017-2018.
And while the self-similar pattern is already playing out as predicted, please read below for further explanation as to why the USD Index’s current and historical price action remains a spitting image:
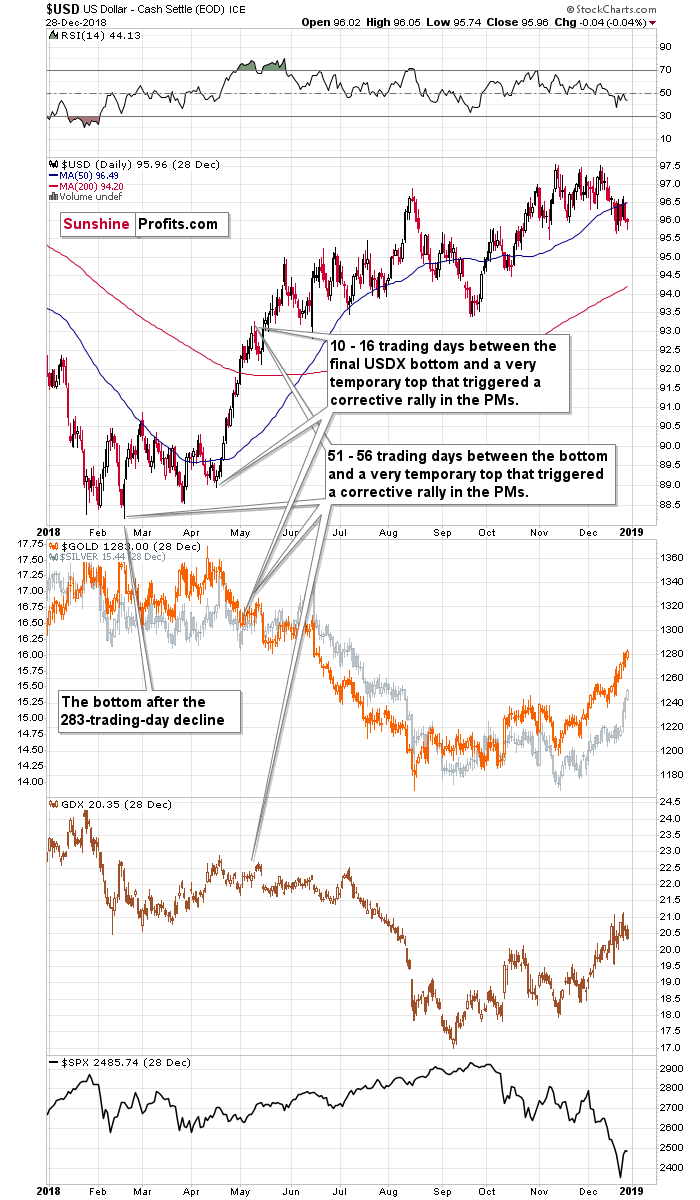
It’s not true that there were no pullbacks during the 2018 rally. There were, but they were simply too small to be visible from the long-term point of view.
The first notable pullback took place in early May 2018, and it contributed to a corrective upswing in the precious metals market. To be precise, the USD Index declined after rallying for 56 trading days, but gold rallied earlier – 51 trading days after the USD Index’s final bottom. The USDX’s immediate-top formed 16 trading days after its final bottom, and gold’s bottom formed 10 trading days after the USD’s final bottom.
Comparing this to the size of the previous decline in terms of the trading days, it was:
- 51 – 56 trading days / 283 trading days = 18.02% - 19.79%
- 10 – 16 trading days / 283 trading days = 3.53% - 5.65%
Also indicating a messy divorce, when the USD Index turned a short-term decline into consolidation in mid-2018, can you guess what happened next? Well, the USD Index moved significantly higher, while gold moved significantly lower.
Please see below:
Moreover, when comparing the pairs’ behavior in mid-2018 to today, it’s ominously similar.
Please see below:
For additional context, I also wrote on Mar. 10:
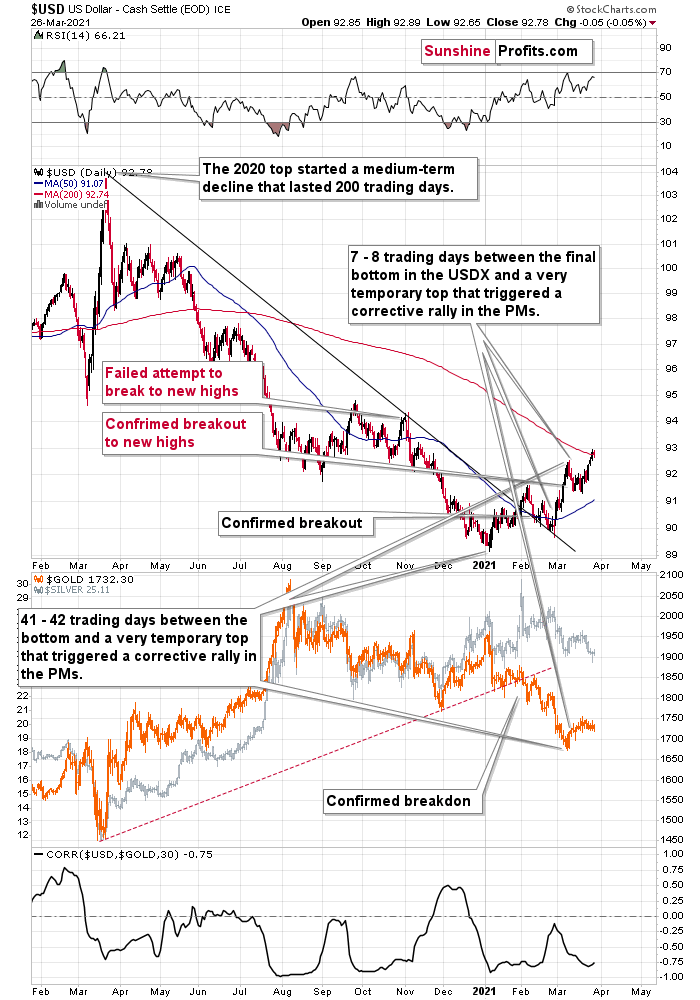
Let’s examine the current situation: the preceding decline lasted for 200 trading days and there were 41 – 42 trading days between the final USDX bottom and the short-term reversals in gold and USDX. Comparing this to the final USDX bottom, we get 7 – 8 trading days.
Applying the previous percentages to the length of the most recent medium-term decline in the USD Index provides us with the following:
- 18.02% - 19.79% x 200 trading days = ~36 - ~40 trading days
- 3.53% - 5.65% x 200 trading days = ~7 - ~11 trading days
The above estimation of about 36 – 40 trading days almost perfectly fits the current 41 – 42-day delay, and the estimation of about 7 – 11 trading days almost perfectly fits the current delay of 7 – 8 trading days.
In other words, the analogy to the 2018 performance does not only remain intact – it actually perfectly confirms the validity of the current corrective upswing. Once again, it’s very likely just a pullback, not a big trend reversal.
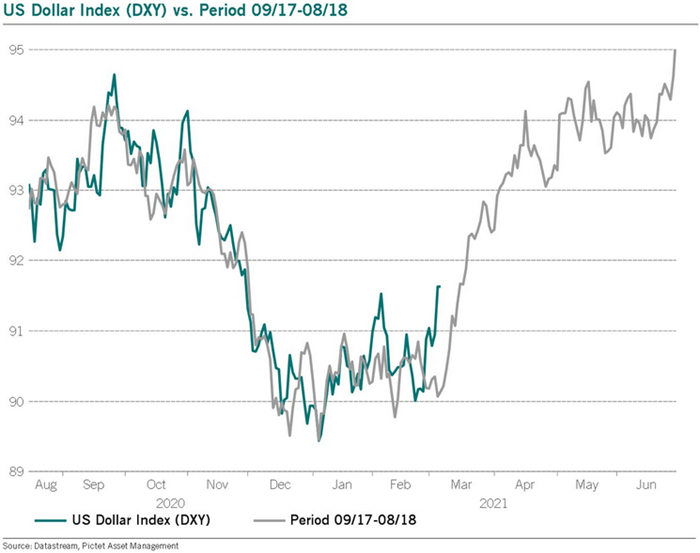
Likewise, a potentially bearish pattern that I have been monitoring – where the USD Index’s price action from July to October 2020 mirrored the price action from December 2020 to February/March 2021– has officially been broken . With the USD Index’s medium-term breakout trumping the former, the potentially bearish pattern has been invalidated and the USD Index is likely to continue its ascension.
But to what end?
Well, if we look back at 2020, the USD Index attempted to recapture its previous highs. But lacking the upward momentum, the failure was followed by a sharp move lower. Today, however, the USD Index has broken above its previous highs and the greenback verified the breakout by consolidating, moving back toward the previous lows and rising once again. Now, the USD Index is visibly above its previous highs .
Taken together, and given the magnitude of the 2017-2018 upswing , ~94.5 is likely the USD Index’s first stop. And in the months to follow, the USDX will likely exceed 100 at some point over the medium or long term.
In conclusion, the USD Index went from being on the ropes to winning the crowd. And with the momentum building and the adrenaline rising, it’s only a matter of time before the USD Index lands another haymaker. Moreover, given the precious metals’ negative correlation with the U.S. dollar – combined with the fact that technicals, fundamentals and sentiment are now riding with the greenback – an uprising could leave the gold, silver, and mining stocks battered and bruised. However, after a tough period of soul searching, the precious metals will regain the heavyweight championship once again. Or, if one wants to put it in more technical terms, gold, silver, and miners are likely to start a massive rally, but only after declining visibly first.
Thank you for reading the above free analysis. It’s part of today’s extensive Gold & Silver Trading Alert. We encourage you to sign up for our free gold newsletter – as soon as you do, you'll get 7 days of free access to our premium daily Gold & Silver Trading Alerts and you can read the full version of the above analysis right away. Sign up for our free gold newsletter today!
Thank you.
Przemyslaw Radomski, CFA
Founder, Editor-in-chief
Tools for Effective Gold & Silver Investments - SunshineProfits.com
Tools für Effektives Gold- und Silber-Investment - SunshineProfits.DE
* * * * *
About Sunshine Profits
Sunshine Profits enables anyone to forecast market changes with a level of accuracy that was once only available to closed-door institutions. It provides free trial access to its best investment tools (including lists of best gold stocks and best silver stocks), proprietary gold & silver indicators, buy & sell signals, weekly newsletter, and more. Seeing is believing.
Disclaimer
All essays, research and information found above represent analyses and opinions of Przemyslaw Radomski, CFA and Sunshine Profits' associates only. As such, it may prove wrong and be a subject to change without notice. Opinions and analyses were based on data available to authors of respective essays at the time of writing. Although the information provided above is based on careful research and sources that are believed to be accurate, Przemyslaw Radomski, CFA and his associates do not guarantee the accuracy or thoroughness of the data or information reported. The opinions published above are neither an offer nor a recommendation to purchase or sell any securities. Mr. Radomski is not a Registered Securities Advisor. By reading Przemyslaw Radomski's, CFA reports you fully agree that he will not be held responsible or liable for any decisions you make regarding any information provided in these reports. Investing, trading and speculation in any financial markets may involve high risk of loss. Przemyslaw Radomski, CFA, Sunshine Profits' employees and affiliates as well as members of their families may have a short or long position in any securities, including those mentioned in any of the reports or essays, and may make additional purchases and/or sales of those securities without notice.
Przemyslaw Radomski Archive |
© 2005-2022 http://www.MarketOracle.co.uk - The Market Oracle is a FREE Daily Financial Markets Analysis & Forecasting online publication.