


For Gold Investors Hope Springs Eternal
Commodities / Gold & Silver Oct 20, 2008 - 02:55 PM GMTBy: Captain_Hook

 Picking things up from yesterday , the theme of today's message is the same, albeit it appears we may have witnessed a temporary bottom in equities with the significant reversals. Rising short sales and put / call ratios are accelerating, showing signs of capitulation, along with the larger equity complex being short-term oversold. So, when you add an exploding liquidity picture to the background combined with falling interest rates around the world – hey – who can argue – it appears a bounce is in order. Here's the sticking point however, as with the 1929 pattern , don't be surprised if lower lows are vexed in late October / early November, as the public may not get sufficiently bearish in the options market in order to keep a sufficient number of negative bets on until closer to election time.
The following is an excerpt from commentary that originally appeared at Treasure Chests for the benefit of subscribers on Tuesday, October 7 th , 2008.
Remember, it has been my contention for some time now that misplaced optimism (call buying) associated with the belief the bureaucracy would not let anything bad happen to the stock market prior to the presidential election is what has largely facilitated the crash, and we have not been disappointed. In extending this logic past the election then, those who trade off the presidential cycle should grow increasingly bearish as November matures, which means index open interest put / call ratios should rise. So again, combined with the unprecedented liquidity now being added to the system, this should provide the conditions for a meaningful reversal higher in the equity complex, with precious metals leading the way.
As mentioned yesterday, the M's are finally responding to all the monetary largesse, which means liquidity is finally getting to the public. This development is of course ‘key' in shaping investment opinion, as if this were not the case one would need remain far more cautious with respect to future prospects for the larger equity complex. This is because stabilization in consumption and credit conditions are necessary to provide the pressure that will squeeze bearish traders out of their positions, giving a lift to equities. For this reason then, and the fact the S&P 500 (SPX) has come close enough to analog / behavior based objectives within our targeted timeframe, short sellers should become increasing defensive at present, with optimization strategies for intermediate swing traders now focusing on precious metals accumulation.
Is this a reversal of our more cautionary comments from last week? Answer: Yes and no. Yes in the sense precious metals stocks can be added back into one's formula more liberally; however, for most, and irrespective of the outsized gains (in relation to bullion) possible in coming weeks, months, and years, bullion should still become an increasing component of one's portfolio in my opinion because a great deal of risk still exists in the stock market. Here, one thing is for sure, precious metals shares have just proven they are more a function of the stock market during illiquid times than silver and gold proxies. Thus, with a good deal more margin debt unwinding undoubtedly scheduled for next year, one will need to remain wary. In terms of ‘risk capital' however, these are the conditions that contrarians dream of, so take this into account you risk takers.
In attempting to aid you in shaping investment policy, it appears as good a time as any to do an in depth review of the precious metals charts from the Chart Room, so why don't we do just that. In terms of a general observations, one of the more profound I can offer is with all the volatility daily plots are almost useless, which means one must allow for larger swings. So because of this, if you want to know what's happening, one must refer to the weeklies and monthlies in order to filter out the noise dailies will produce under such conditions. This is of course exactly what we have done in preparing this review.
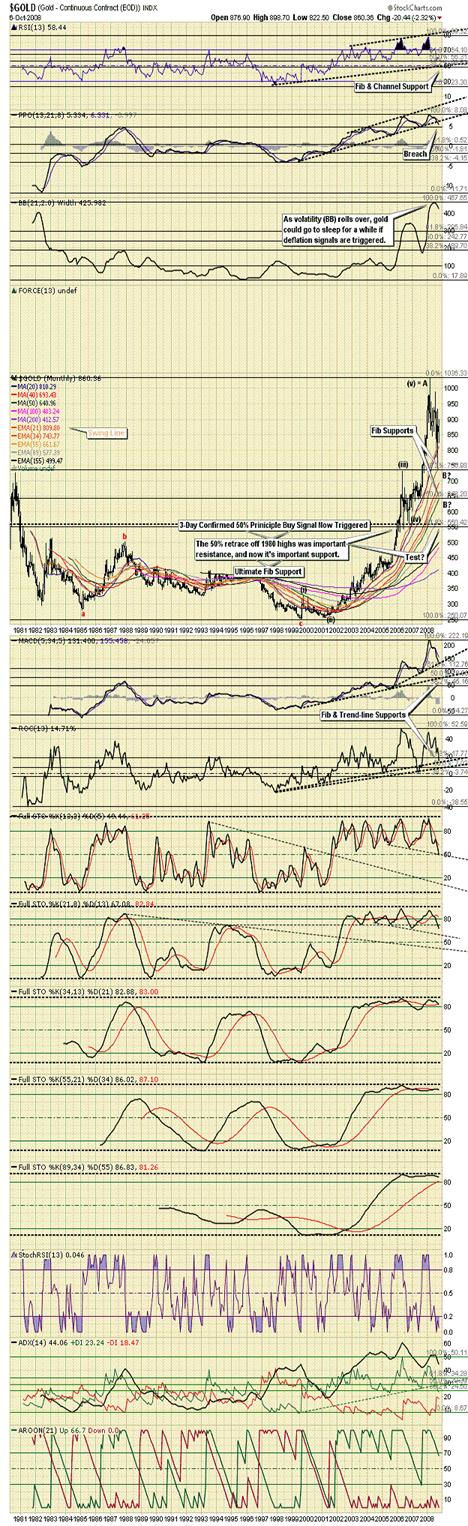
The first chart we look at is that of monthly gold. In terms of significant observations, perhaps the most profound is that unlike precious metals shares volatility has rolled over, creating a divergence of sorts. Why is this occurring? Well, for one thing, the physical shortages in the metals are ‘no joke', which means as increasing numbers attempt to secure wealth in real money, despite the deflationary influence of collapsing paper markets prices hold firm. This should ultimately be considered a bullish factor, where once share markets stabilize; the entire complex has customarily enjoyed significant returns. That being said however, when looking at the other indicators, with particular attention on RSI as a ‘key definer', it appears more downside may be in store if the channel bottom is to be vexed. (See Figure 1)
Figure 1
Moving onto the weekly Amex Gold Bugs Index (HUI) we get confirmation of the probability for more downside in that a rather large five-wave pattern has now traced out to go along with the indicator (diamonds) and stochastic breaks, all having longer-term bearish implications. Here, the thinking is if this is a mid-term correction for the sector, then assuming we see seasonal strength in stocks into the first quarter of next year, a three-wave corrective rally in precious metals shares should ensue as well, only to be followed by yet another five-wave sequence afterward to complete a larger degree zigzag (5 – 3 – 5). What's more, don't be surprised if more near-term downside is seen into a capitulation low later this month closing in and around the Golden Retrace objective. It may have been vexed close enough yesterday, however nothing should surprise given present conditions. (See Figure 2)
Figure 2

Certainly the monthly HUI chart also allows for more downside here, so again, one should not be surprised if this were to occur. Again, if it does not occur now, later on it should in completing the larger degree zigzag discussed above. I just noticed gold has now put in five waves upon the hourly chart from the lows vexed yesterday, but silver is still counting in threes. If silver does not play some serious catch-up in this regard soon, this will confirm the move higher in gold will be shallow and that more downside in the sector should be anticipated. This would correspond to the indicated MACD and Bollinger Band (BB) targets denoted below being hit. (See Figure 3)
Figure 3

To say the monthly Philadelphia Gold And Silver Index (XAU) plot is interesting at this point is putting it mildly, with stochastic influences and indicators all pointing to lower prices, while in spite of this noticing prices held important trend-line and Fibonacci (61.8%) support yesterday. Based on all the evidence however, where further downside in the broad measures of stocks will likely continue to sponsor continued hedge / mutual fund liquidations, it's looking increasingly possible these supports could be overcome near-term before a more lasting bottom is put in place. (See Figure 4)
Figure 4

Adding to this sentiment is the fact structural supports are falling across the sector, with the HUI / Gold Ratio severely testing the boundaries of what use to be a well defined inverse head and shoulders pattern. What's worse in terms of the bearish case, which is purely a liquidity / panic related issue at this point, is the incomplete nature of the move in the BB indictor however, suggestive larger capitalization precious metals shares are still subject to a great deal of risk. (See Figure 5)
Figure 5

And this sentiment is confirmed in the next chart, that of the monthly Amex Gold Miners Index (GDM). Here, we have an identifiable structure providing an quantifiable measured move (MM) target, which as you may know, is something we enjoy in providing a track to run on. And as you can see, with another leg down apparent, the message is be patient, as lower lows are anticipated. Notice structural support was broken here long ago with the GDM being populated with juniors. (See Figure 6)
Figure 6

In an up to date side-note with respect to the above, because the various precious metal share indexes have all fallen through their Golden Retracements (61.8%) of the entire move off year 2000 lows, chances of failures to 78.2% retrace targets remain high. Structural breaks and stochastic influences also point to this possibility.
Unfortunately we cannot carry on past this point, as the remainder of this analysis is reserved for our subscribers. Of course if the above is the kind of analysis you are looking for this is easily remedied by visiting our continually improved web site to discover more about how our service can help you in not only this regard, but also in achieving your financial goals. For your information, our newly reconstructed site includes such improvements as automated subscriptions, improvements to trend identifying / professionally annotated charts , to the more detailed quote pages exclusively designed for independent investors who like to stay on top of things. Here, in addition to improving our advisory service, our aim is to also provide a resource center, one where you have access to well presented ‘key' information concerning the markets we cover.
nd if you have any questions, comments, or criticisms regarding the above, please feel free to drop us a line . We very much enjoy hearing from you on these matters.
Good investing all.
By Captain Hook
http://www.treasurechestsinfo.com/
Treasure Chests is a market timing service specializing in value-based position trading in the precious metals and equity markets with an orientation geared to identifying intermediate-term swing trading opportunities. Specific opportunities are identified utilizing a combination of fundamental, technical, and inter-market analysis. This style of investing has proven very successful for wealthy and sophisticated investors, as it reduces risk and enhances returns when the methodology is applied effectively. Those interested in discovering more about how the strategies described above can enhance your wealth should visit our web site at Treasure Chests
Disclaimer: The above is a matter of opinion and is not intended as investment advice. Information and analysis above are derived from sources and utilizing methods believed reliable, but we cannot accept responsibility for any trading losses you may incur as a result of this analysis. Comments within the text should not be construed as specific recommendations to buy or sell securities. Individuals should consult with their broker and personal financial advisors before engaging in any trading activities, as we are not registered brokers or advisors. Certain statements included herein may constitute "forward-looking statements" with the meaning of certain securities legislative measures. Such forward-looking statements involve known and unknown risks, uncertainties and other factors that may cause the actual results, performance or achievements of the above mentioned companies, and / or industry results, to be materially different from any future results, performance or achievements expressed or implied by such forward-looking statements. Do your own due diligence.
Copyright © 2008 treasurechests.info Inc. All rights reserved.
Unless otherwise indicated, all materials on these pages are copyrighted by treasurechests.info Inc. No part of these pages, either text or image may be used for any purpose other than personal use. Therefore, reproduction, modification, storage in a retrieval system or retransmission, in any form or by any means, electronic, mechanical or otherwise, for reasons other than personal use, is strictly prohibited without prior written permission.
Captain Hook Archive |
© 2005-2022 http://www.MarketOracle.co.uk - The Market Oracle is a FREE Daily Financial Markets Analysis & Forecasting online publication.