Gold to Benefit from Mounting US Debt Pile
Commodities / Gold and Silver 2021 May 14, 2021 - 01:11 PM GMTBy: Richard_Mills
Gold bugs are closely watching what happens with Treasuries. Last year, the gold price hit a record high of $2,034/oz, largely due to the fact that investors were piling into bonds as a safe haven against pandemic-related uncertainty. A descending US dollar and negative real rates (when bond yields minus the inflation rate fall below 0%) were also important antecedents.

Over the past several weeks yields have been rising on expectations of inflation, due to trillions being spent by governments on covid-19 pandemic relief spending and infrastructure programs designed to revive flagging economies.
Climbing yields, as investors rotate funds out of bonds into stocks, on increasing confidence in the economy, is the primary reason why the prices of precious metals gold and silver have pulled back in recent weeks. For now.
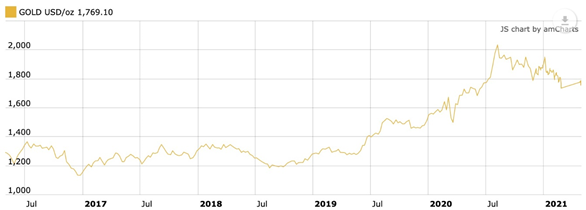
Spot gold, 5-year chart. Source: Kitco
Consumer spending is predicted to rise dramatically as national vaccination programs become effective against the disease and economies open-up further, facilitating more spending, borrowing and economic growth.
Inflation rising
The blistering speed of recovery in the US — economists are predicting annual GDP growth of 6.5%, versus a 2020 contraction of 3.5% — is stoking fears of inflation. (the economy grew at 6.4% in Q1)
Gold is a hedge against inflation, so it is generally bought when inflation goes up, or looks like it will, to guard against currency devaluation.
We know from a previous article that the purchasing power of most Americans earning wages or collecting a salary, has stagnated over the past four decades. This is all down to inflation and the inability of fiat currencies to protect against it.
US wages have failed to keep up with the rate of inflation. The wage and salary earner are literally getting screwed every day because the value of the dollar is being devalued by a fractionally small amount. Over time, however, the diminished value is huge.
The dollar has lost 90% of its purchasing power since 1950.
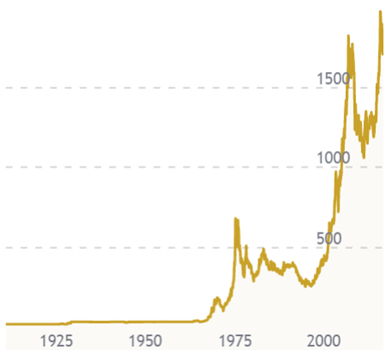
By contrast, since 1972 gold has gone from $35/oz to $1,750.
The US inflation rate has already doubled within a matter of months and is likely heading to 3% by June. Reuters reports labor costs in the United States jumped 0.9% in the first quarter, providing further evidence US inflation will go higher.
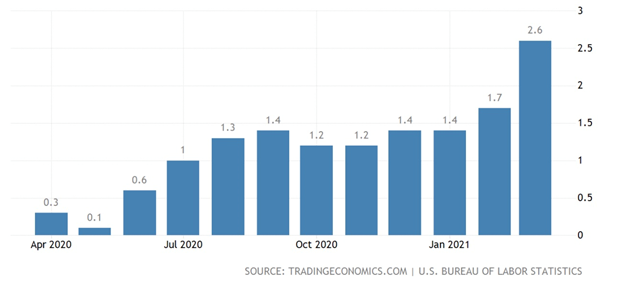
US inflation rate. Source: Trading Economics
In China a strong economy coming out of the pandemic has already pushed its producer price index up the highest in three years. Rising prices in the world’s biggest exporter threaten to stoke inflation around the world.
German inflation has also taken flight, climbing 2.1% in April, after Europe’s largest economy raised its growth forecast to 3.5% from an earlier 3%, on expectations of higher household spending as covid-19 restrictions are lifted.
In 2021 we’re emerging from the pandemic shutdown, which cratered growth and slammed the economy — depressing price pressures, not unlike what the price-control program did 50 years ago. Today’s Fed policies are even more expansive. And Congress has just enacted a $1.9 trillion stimulus bill—on top of earlier relief bills costing another nearly $2 trillion, a lot of which remains unspent and will continue to fuel demand this year and beyond.
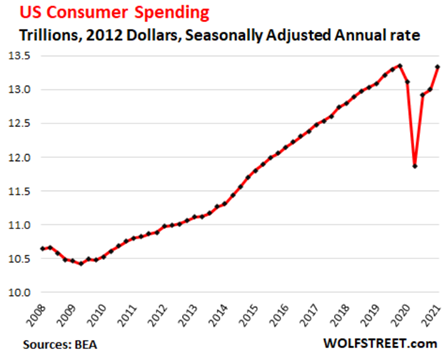
Although gold hasn’t yet reacted to rising inflation in the US, we expect it will, eventually.
The $6 trillion-dollar man
Struggling to contain the economic fallout from the pandemic, central bankers have realized that keeping interest rates low and maintaining monthly asset purchases (ie. quantitative easing), have not given the desired economic boost; now they are counting on fiscal policy, ie., government spending and taxes, to do the trick. However, the US government does not have the money, so they borrow (print) it, at current rock-bottom interest rates.
A $2.3 trillion US deficit is predicted for 2021, not as high as 2020’s $3.1 trillion but more than double 2019’s $984 billion, and that is before the $1.9 trillion American Rescue Plan that recently passed Congress and has Biden’s signature.
More spending is on the way. A LOT MORE.
Biden’s $2.3 trillion economic recovery package, unveiled in late March, has as its centerpiece the biggest infrastructure spending commitments since Roosevelt’s New Deal. It includes typical “blacktop” improvement projects such as roads, bridges, ports, airports and public transit, as well as billions in funding for electric vehicle development.
More than $300 billion would be put into improving drinking water infrastructure, expanding broadband internet and upgrading electrical grids, plus another $300B for building affordable housing and constructing/ upgrading schools.
Notably, Biden’s Democrats propose to pay for this $2.3T program through corporate tax increases over 15 years.
That is good news for America’s mounting debt burden, currently sitting at $28 trillion, because such large spending commitments are typically financed by the government.
However a little-publicized law being drafted by House Democrats would substantially increase spending on so-called “green” infrastructure and climate change initiatives.
Progressive politicians and climate groups have criticized Biden’s plan as falling short of enough money necessary to head off the negative impacts of climate change. They are therefore attempting to revive the “Green New Deal”.
First introduced in 2019, the 14-page Green New Deal seeks to eliminate US greenhouse gas emissions within a decade and transition the economy away from fossil fuels.
New aspects of the plan include authorizing up to $1 trillion for cities, tribes and territories to fund their own localized versions of the Green New Deal; and up to $172 billion on public housing over 10 years, more than quadruple what the Biden White House is proposing.
Although the Green New Deal is merely a resolution, not legislation, the THRIVE Act was crafted following the Deal’s introduction in 2019. It is slated to be brought forward by a group of congressional Democrats, to advance the goals of the resolution.
Over 10 years, the THRIVE Act would spend about $9.5 trillion, nearly four times more than Biden’s $2.3 trillion American Jobs Plan (aka the infrastructure bill) proposes.
Moreover, THRIVE would spend about 10 times more on clean energy, and adds $1.6 trillion to support carbon-reduced farming.
It is likely to face strident opposition from Republicans — remember, not one GOP member in the House of Representatives voted for Biden’s $1.9T covid-19 package — but if the Dems led by Senator Bernie Sanders decide to make the THRIVE Act a reconciliation bill, it would almost certainly pass, meaning a quadrupling of climate-related spending beyond what Biden has already committed to.
This week the president came out with a third spending package, a $1.8 trillion plan for “children and families”. (in quotes because much of the spending appears to be socialist-tinged goodies such as free college tuition, money for child care, healthcare, paid medical leave, etc.)
The new proposal includes $1 trillion in investments plus $800 billion in tax credits, and like the $2.3T infrastructure plan would be offset by tax increases over 15 years.
If the THRIVE Act and the three spending packages rolled out by the Biden administration all pass Congress (admittedly a big IF) they would make Biden a $16 trillion-dollar man.
Though some of this spending is to be offset by tax increases, we don’t believe for a minute that a good proportion of it will not be borrowed, printed, or both.
Gold and debt to GDP
Remember, the US government has already spent $4.5 trillion on pandemic-related relief, helping to boost the national debt to $28 trillion in under a year.
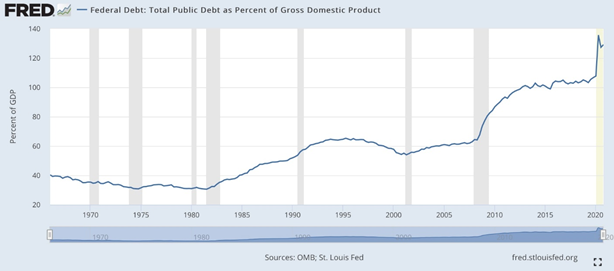
In October 2020, the debt zoomed past 100% of GDP, for the first time since the Second World War, but that was just the beginning.
The Congressional Budget Office (CBO) is projecting that with all of this year’s spending, the national debt in 2021 could balloon to $35 trillion! And that is before adjusting for fiscal stimulus.
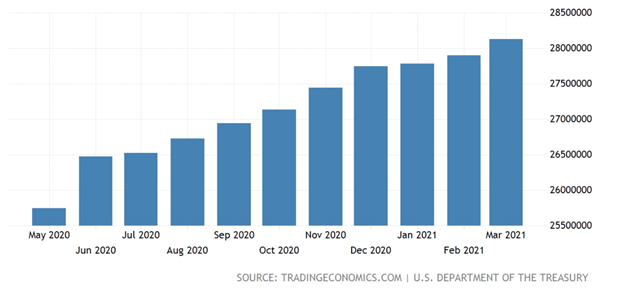
US national debt. Source: Trading Economics
There is a historically close correlation between gold prices and debt to GDP. The higher the ratio, the better it is for gold.
(Adding the $1.9T covid relief bill to the $4.5T already spent gives $6.4T, plus the nearly $8T the Fed has added to its balance sheet leaves roughly $14 trillion, or half the national debt. This doesn’t include the $2.3T infrastructure program nor the $1.8T in spending on children and families)
This new spending, which would be unprecedented, is in addition to the loose monetary policy that is being followed by the Fed, meaning continued asset purchases to increase the money supply, and keeping interest rates close to zero. So far, the Fed’s creation of money literally “out of thin air” has added about $4 trillion to its balance sheet since covid-19 hit.
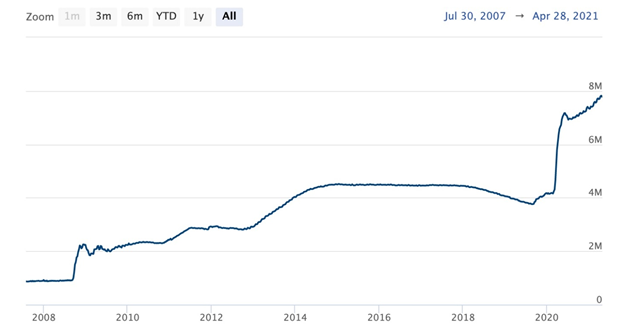
Total assets of the US Federal Reserve. Source: Federal Reserve
Thus, we have monetary easing happening at the same time as fiscal spending “carte blanche” (remember Biden believes strongly in the power of the state to tax and spend. A long wish list waits to be filled, with little to no concern regarding the already out of control $28 trillion national debt, courtesy of Modern Monetary Theory, or MMT)
By 2031 the Congressional Budget Office predicts debt to GDP will hit 107% and by 2051, as deficits grow and interest rates eventually rise, the ratio could reach 202%. At that rate, for every dollar the US economy produces, $2 is borrowed.
“Record Trade Deficit, a massive drag on GDP. The balance of “net exports” (exports minus imports, namely the infamous trade deficit) worsened by 4.8% in Q1, from the prior quarter, to a new all-time worst of -$1.18 trillion (annual rate 2012 dollars).’ Wolfstreet.com
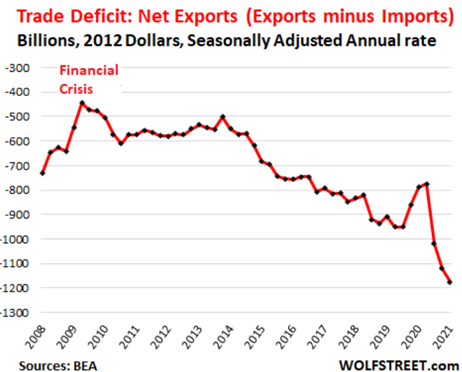
Exports add to GDP, imports reduce GDP
Low rates have clearly been a significant enabler of sky-rocketing debt. S&P Market Intelligence notes that despite public debt more than doubling between 2010 and 2020, interest costs only grew 26%, from $414B to $523B. With net interest just 1.6% in 2020, compared to 3% in 1985, the cost of the national debt is half what it was 10 years ago.
Also, QE’s success in holding down yields has eliminated the US Federal Reserve’s maneuvering room. The Fed must continue quantitative easing to monetize the issuing of Treasuries, which are needed to fund deficits, states S&P.
Forbes reported on March 10 that the US budget deficit continues to soar to unprecedented levels — with the gap between spending and revenues widening to more than $1 trillion in the first five months of the 2021 fiscal year. (by comparison, the deficit was $1 trillion before covid)
Conclusion
As mentioned high debt to GDP levels are good for gold prices, as are negative real interest rates, arguably the best predictor of price direction.
The demand for gold moves inversely to interest rates — the higher the rate of interest, the lower the demand for gold, the lower the rate of interest the higher the demand for gold.
The reason for this is simple, when real interest rates (interest rate minus inflation) are low, at, or below zero, cash and bonds fall out of favor because the real return is lower than inflation.
If you are earning 1.6% on your money from a government bond, but inflation is running 2.7%, the real rate you are earning is negative 1.1% — an investor is actually losing purchasing power. Gold is the most proven investment to offer a return greater than inflation, by its rising price, or at least not a loss of purchasing power.
Despite Treasury yields rising recently, we already have negative real rates (1.63% on the 10-year minus 2.6% inflation equals -0.97%).
It’s a little bit strange that gold prices haven’t yet reacted to negative real rates by heading back up, but there are competing forces happening, a push and pull between yields and inflation. The more negative that number goes, either due to higher inflation or lower yields, the better it is for gold.
Gold investors are also influenced by the US dollar.
Sooner or later people must realize that with all the money-printing that goes along with the tax and spend Biden administration, combined with runaway growth due to economies coming out of the pandemic, we are going to be struck by a major bout of inflation.
Over time, as we showed in the ‘One Dollar’ chart above, inflation erodes the purchasing power of fiat currencies and eventually they become worthless.
We’re not suggesting that could happen to the US dollar anytime soon, but we do know that the US relationship with China is a major determinant of the dollar’s direction. As the largest holder of US Treasuries in the world, Beijing has the ability to crash the dollar if it wanted to. Of course it doesn’t, because China needs to keep buying dollar-denominated assets so that it can keep purchasing commodities, priced in dollars, to grow its massive economy.

US dollar index. Source: MarketWatch
Leaving aside the various ways in which Beijing is moving away from the dollar-dominated global economy, we see continued conflict between the US and China on the horizon, with the dollar front and center in the battle. Not necessarily a shooting war, although the situation with Taiwan and the South China Sea means there is always that possibility.
Consider: the trade war between them is not over. Four years after slapping 25% tariffs on China, those tariffs remain. The Biden administration is said to be examining the Phase 1 trade deal reached but no changes have yet been made.
As The Diplomat states, Until the trade war is resolved, losses from higher costs will continue to mount. High U.S. tariffs remain on $370 billion of products imported from China. These cover a wide range of goods, from machinery parts to seafood.
Note that the US trade deficit hit a record-high $90 billion in March, with goods imports of $232.6 billion exceeding exports of $142 billion.
Donald Trump spent four years trying to beat China and bring US jobs back by imposing tariffs, but he failed; jobs lost to out-sourcing have not returned. According to MarketWatch, manufacturing production peaked in December 2018 and hasn’t come back to those levels.
The trade war also failed because Trump’s attempt to have a low dollar ran up against the dollar’s “exorbitant privilege” as the world’s reserve currency.
When covid-19 hit, investors inevitably clambered for dollars, thus increasing the greenback’s value and making the US trade deficit with China worse.
We foresee a period in the near future when the US and China try to out-compete each other, by devaluing their currencies in a kind of tit for tat “race to the bottom”.
There’s no doubt that China is on the ascent — just look where it is in relation to the rest of the world in coming out of the pandemic — the country controls many of the world’s metals, both mining and processing, and it is bulking up its military, to the point where attacking it in the South China Sea would be courting disaster. The US is an empire in decline, and China knows it.
One thing Biden has right is his assertion that unless the US is able to match up against China in its infrastructure, China is going to “eat its lunch”.
Arguably the US could if it really wanted to, target its decaying infrastructure by focusing spending accordingly, instead of wishy-washing fiscal packages that include all sorts of promises that have nothing to do with “building back better”.
Put people back to work with real jobs that improve the backbone of the US economy (infrastructure) while paying a high enough wage to support a family and not have to rely on government largesse.
How’s this for a shocking statistic? In March the amount of money the US government paid out in unemployment benefits, welfare checks etc., reached an annualized $8.1 trillion, double February’s total and $5 trillion above pre-covid, when transfers were about $3.2 trillion. These numbers show how reliant on the government the US population has become.
If the US could bring back manufacturing, perhaps it would have a chance of “eating China’s lunch”.
The more likely scenario, unfortunately, is money-printing “out the wazoo” bearing ridiculously high deficits and debt, a currency war with China, and finally, hyperinflation leading to the destruction of the US dollar.
We don’t know how or when these events could take place, but we do know that holding gold or silver is your best insurance.
By Richard (Rick) Mills
If you're interested in learning more about the junior resource and bio-med sectors please come and visit us at www.aheadoftheherd.com Site membership is free. No credit card or personal information is asked for.
Richard is host of Aheadoftheherd.com and invests in the junior resource sector. His articles have been published on over 400 websites, including: Wall Street Journal, Market Oracle, USAToday, National Post, Stockhouse, Lewrockwell, Pinnacledigest, Uranium Miner, Beforeitsnews, SeekingAlpha, MontrealGazette, Casey Research, 24hgold, Vancouver Sun, CBSnews, SilverBearCafe, Infomine, Huffington Post, Mineweb, 321Gold, Kitco, Gold-Eagle, The Gold/Energy Reports, Calgary Herald, Resource Investor, Mining.com, Forbes, FNArena, Uraniumseek, Financial Sense, Goldseek, Dallasnews, Vantagewire, Resourceclips and the Association of Mining Analysts.
Copyright © 2021 Richard (Rick) Mills - All Rights Reserved
Legal Notice / Disclaimer: This document is not and should not be construed as an offer to sell or the solicitation of an offer to purchase or subscribe for any investment. Richard Mills has based this document on information obtained from sources he believes to be reliable but which has not been independently verified; Richard Mills makes no guarantee, representation or warranty and accepts no responsibility or liability as to its accuracy or completeness. Expressions of opinion are those of Richard Mills only and are subject to change without notice. Richard Mills assumes no warranty, liability or guarantee for the current relevance, correctness or completeness of any information provided within this Report and will not be held liable for the consequence of reliance upon any opinion or statement contained herein or any omission. Furthermore, I, Richard Mills, assume no liability for any direct or indirect loss or damage or, in particular, for lost profit, which you may incur as a result of the use and existence of the information provided within this Report.
© 2005-2022 http://www.MarketOracle.co.uk - The Market Oracle is a FREE Daily Financial Markets Analysis & Forecasting online publication.


