


The U.S. FED: What! Me Worry?
Economics / Money Supply Oct 21, 2008 - 07:48 PM GMTBy: David_Haas

 From time-to-time, I like to swing by the Federal Reserve Bank of St. Louis (FRBSL) website to check on their “aggregate” monetary and financial indicators and measure the pulse of our nation's economic base - which is the overall supply of money and credit in the United States economy.
When you have a financial system that is literally “loaned into existence at interest” , as ours is, monitoring the condition of the foundational credit base is critical to understanding money supply, inflation, recession, expansion, etc. Though there's an abundance of great research and information presented by the FRBSL, some of my favorite charts can be found in the area called FRED.
In addition to introducing readers to FRED data, a second motivation for making this post today is to “respond with pictures” to skeptical comments I received from one reader, a licensed Wall Street representative, who contends that the fears of the global credit crisis are wholly overblown (in his “informed” opinion, to which he is entitled). He seemed to imply that the whole thing would likely blow over like a powerful sneeze in the back of church, despite acknowledging in his letter the many leveraged trillions risking, in some ratio, much of the financial capital positioned around the globe.
He may or may not be right and I, for one, won't pretend to make any guesses about the future. All I ever wished to do in my writing on this topic is to point out some of the verifiable, “officially reported” data I find that I see as being potentially relevant in helping readers become better informed as they seek to evaluate possibilities or probabilities of WHAT THEY SEE HAPPENING in the future. And, while watching the actions of the FED is a valuable tool for some, it's of little use to others.
Either way, one thing will become jarringly obvious to anyone who views the charts below and that is; for whatever reason , the ham-fisted FED appears to be mashing down hard on their panic button. As I see it, if our economy were a car and the FED were driving it, they'd be stomped into passing gear with the gas pedal pressed down hard on the floor and the tachometer swooshing through the red-line deep into the engine-blowing danger zone. Whew! We could all guess what probably happens if you drive your car this way and it's no wonder many of us have sweaty palms just from watching them! (Question: Does anybody know the cost of replacing a country's economic engine or who could make the repair?)
But, I don't want you to take my word for it. Since a picture is worth a thousand words, I'll let the following pictures - taken straight from current material available online at the FRBSL website - tell the rest of the story in this post for me.
Total Borrowings of Depository Institutions from the Federal Reserve - Through 2008-10-15
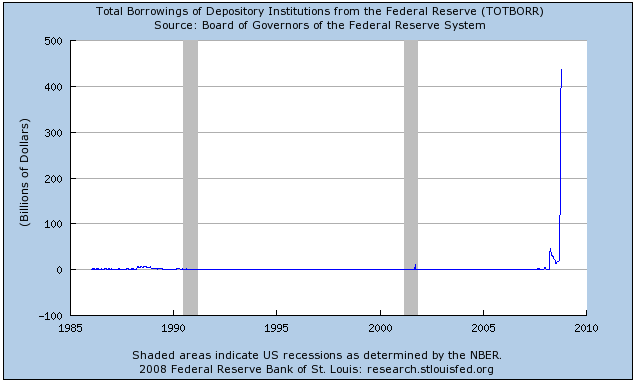
Is this a credit binge or a moonshot?
Net Free or Borrowed Reserves of Depository Institutions - Through 2008-09-01

Where did all the reserves go?
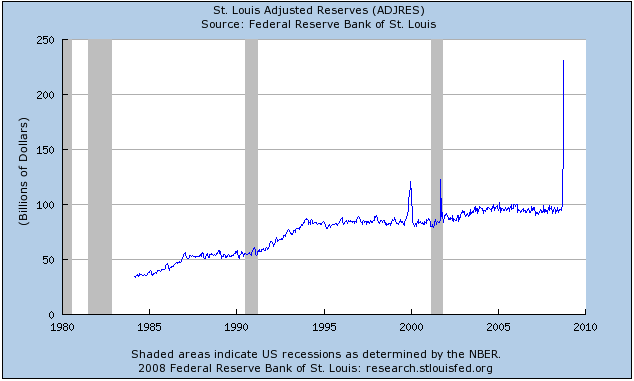
St. Louis Adjusted Reserves - Through 2008-10-08
Federal Debt Held by Federal Reserve Banks - Through 2008-06-30
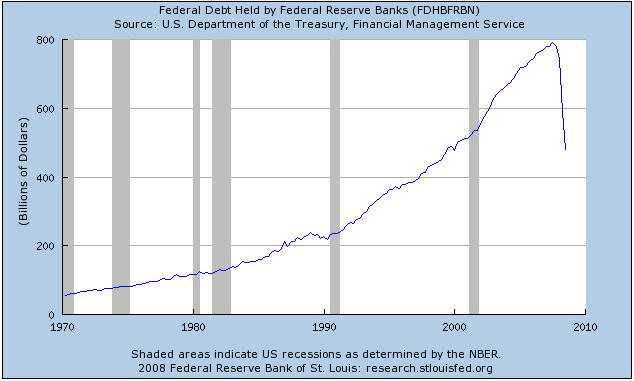
Where is this debt all going?
Federal Government Debt: Total Public Debt - Through 2008-06-30

Up Approximately 64% Since the 2001-2002 Time-frame. Inflationary? Perhaps, unless it's being sucked into a financial black hole.
Privately Owned Housing Starts: 1-Unit Structures - Through 2008-09-01

Remember, we may STILL NOT BE in a recession.
Household Debt Service Payments as a Percent of Disposable Personal Income - Through 2008-04-01

Have consumers finally reached a tipping point in their ability to consume?
Nonperforming Total Loans, Banks with Total Assets from $1B to $10B - Through 2008-06-30

Nonperforming Loans at Mid-size Banks. No recession?
I've just touched on a just a few high spots but, for those who are interested, there's a ton of information left to sift through in the FRED database. With these graphs, I've provided a fairly concise yet comprehensive look at what seems to be happening, thus far, on the monetary front and with the downturn in our consumer-driven economy. Just remember, while most of these graphs are current to within the last few months, none of them reflect the rather dramatic central bank actions taken within the past couple of weeks . Therefore, I expect even more “parabolic” or vertical changes to show up in these same graphs in months to come.
Possibly the main point to be gleaned from looking through the graphs I've presented is that there is little doubt we're witnessing historic actions and, most likely, historic changes. The longer-term graphs show us that there is SIMPLY NO PRECEDENT for the scale of monetary action or reaction that we're seeing today. How such historic acts might manifest themselves in our country's future remains the great mystery of the day. All we know for certain is drastic actions have been taken and nothing happens without consequence in the world of economics. Would it be reasonable to presume that the resultant success or failure may be equally dramatic? Stay tuned, we'll find out shortly.
For those of you who may not think anything you see here is noteworthy, notice that the scale of the Federal Reserve responses shown here is measured only in the billions. Then go and re-read my article “ The Crushing Potential of Financial Derivatives “ . That article was intended to “put things into perspective” and based upon the enthusiastic response from readers, it seemed to do just that. If you haven't read it before, I suggest you be sure to settle into a comfortable chair while doing so.
For more interesting articles and commentary please visit: http://www.haasfinancial.com
By David Haas
Consultant
In my consulting practice, I work with individuals, business owners, and professionals. I assist business owners and professionals in several critical areas ranging from business start-up, marketing, operational challenges, employee retention, and strategic planning to personal asset protection, financial, and retirement income planning. Often, these areas relate and need to be integrated to work most effectively. I also assist business owners in developing exit-strategies that enable them to maximize the value of their business interests and preserve their lifestyle in retirement. For individuals, I primarily focus on tax reduction, financial, and retirement income planning.
© 2008 David Haas, Consultant
David Haas Archive |
© 2005-2022 http://www.MarketOracle.co.uk - The Market Oracle is a FREE Daily Financial Markets Analysis & Forecasting online publication.