Economic Recession Forecasting "V" or "U" Shaped?
Economics / Recession 2008 - 2010 Oct 22, 2008 - 10:47 AM GMTBy: Paul_L_Kasriel
 Years ago there was an equity strategist at Bache-Halsey (I said it was years ago) who almost always got it wrong. When he finally was forced to leave "to pursue other interests," clients were furious. The guy was a near-perfect negative indicator. When he said buy, it usually paid off to sell.
You know where this is going. A certain "economist" is forecasting a "V"-shaped economic and stock-market recovery based on a forecast of a "V"-shaped recovery in monetary velocity.
The definition of monetary velocity is nominal GDP divided by the nominal supply of money. Monetary velocity is another way of describing the public's demand to hold money. Rising monetary velocity implies that the public's demand for money balances is falling and vice versa .
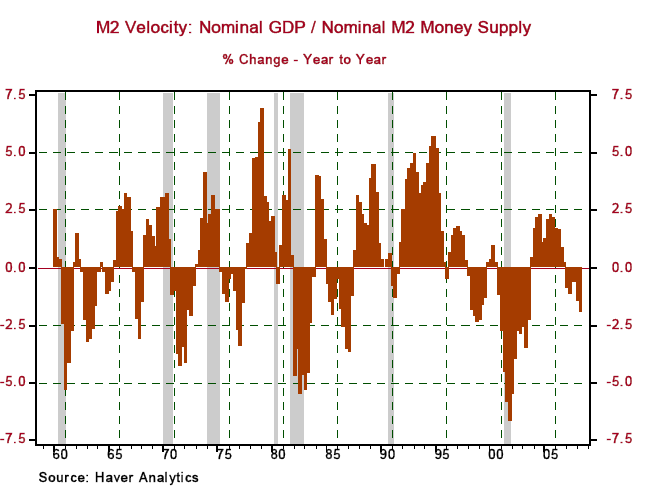
Chart 1 below shows the year-over-year historical behavior of monetary velocity in terms of the M2 money. The shaded areas are periods of recession. Notice that the change in velocity tends to contract in the early quarters of business recoveries. In 1992, a year after the economic recovery commenced in the second quarter of 1991, velocity did grow relatively rapidly in what was termed the "jobless recovery." In general, then, history is not on the side of a sharp rebound in monetary velocity anytime soon.
Chart 1

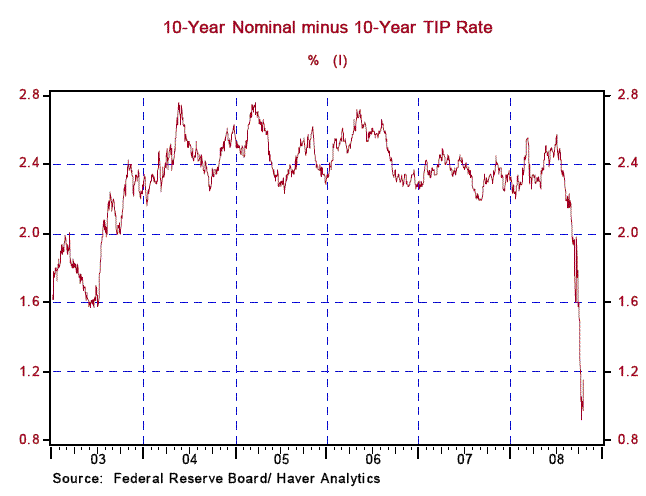
Economic theory also is not on the side of a quick turnaround in monetary velocity. Chart 2 shows the history of household deposits and money fund shares as a percent of household net worth (wealth). From the first quarter of 1952 through the second quarter of 2008, the median percentage of household deposits and money fund shares to household net worth has been 14.4%. In the second quarter of 2008, the percentage was 13.3, more than 100 basis points below the median. With the recent volatility and declines in the stock market, with declining home values, with slowing inflation and with the collapse in inflation expectations (see Chart 3), it would seem reasonable that households might want to increase their relative holdings of an asset that is redeemable at par (now that the amount of an FDIC-insured bank account has been increased and federal insurance of money fund balances has been authorized.)
Chart 2

Chart 3

Of course, any money and banking student knows, even if the anonymous erroneous "economist" might not, that velocity is only one component of the GDP identity. Another component is the amount of money created. And any money and banking student knows - at least any of my past students - that the supply of money depends on the growth in earning assets (loans and investments) of depository institutions. With banks suffering from "capital inadequacy" these days, it is unlikely that their earning assets will be growing rapidly anytime soon. Ergo, the supply of money is unlikely to grow rapidly anytime soon. (It has in the past couple of weeks, but this appears to be an aberration.)
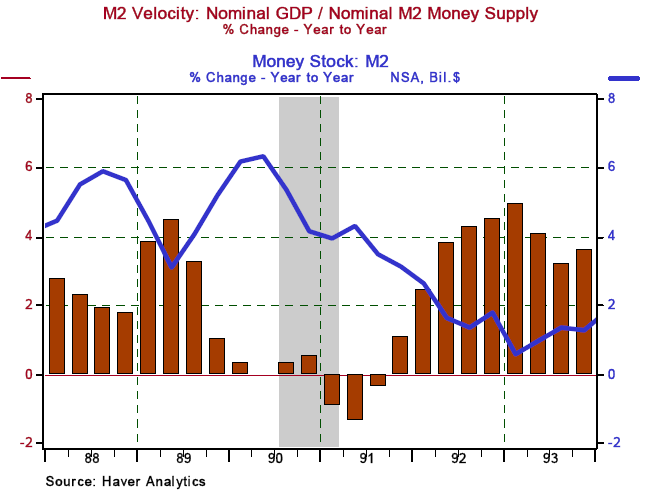
I want to return to a discussion of the "jobless recovery" of 1992. Chart 4 shows the year-over-year change in M2 velocity as well as the year-over-year change in the M2 money supply itself. Notice that as M2 velocity growth picked up, M2 growth was decelerating to what was a very low rate. If you recall, the early 1990s were years when banks suffered from severe "capital inadequacy" that restricted their lending to the private sector.
Chart 4

In sum, both history and theory do not suggest a near-term surge in monetary velocity. Moreover, theory suggests very sluggish growth in the broad money supply. As a result, the odds of a "V"-shaped economic recovery are low. But even a blind pig finds an acorn once in awhile. So, there is some finite probability that the aforementioned anonymous "economist" might be right this time. It would be a shame, however, if he or she were right. Then his or her worth as a reliable negative indicator would be diminished.
As an aside, if you can guess the name of the anonymous "economist," you will win a lifetime free subscription to the "Daily Global Economic Commentary."
By Paul L. Kasriel
The Northern Trust Company
Economic Research Department - Daily Global Commentary
Copyright © 2008 Paul Kasriel
Paul joined the economic research unit of The Northern Trust Company in 1986 as Vice President and Economist, being named Senior Vice President and Director of Economic Research in 2000. His economic and interest rate forecasts are used both internally and by clients. The accuracy of the Economic Research Department's forecasts has consistently been highly-ranked in the Blue Chip survey of about 50 forecasters over the years. To that point, Paul received the prestigious 2006 Lawrence R. Klein Award for having the most accurate economic forecast among the Blue Chip survey participants for the years 2002 through 2005.
The opinions expressed herein are those of the author and do not necessarily represent the views of The Northern Trust Company. The Northern Trust Company does not warrant the accuracy or completeness of information contained herein, such information is subject to change and is not intended to influence your investment decisions.
Paul L. Kasriel Archive |
© 2005-2022 http://www.MarketOracle.co.uk - The Market Oracle is a FREE Daily Financial Markets Analysis & Forecasting online publication.


