


Gold And Silver – Which Will Have An Explosive Price Rally And Which Will Have A Sustained One?
Commodities / Gold and Silver 2021 Jul 28, 2021 - 01:03 PM GMTBy: Chris_Vermeulen

Our followers and readers have been emailing us asking for more research into Precious Metals and updated Adaptive Dynamic Learning (ADL) Price Modeling charts (our proprietary price/technical mapping system capable of predicting future trends, setups, and price levels). This special Gold and Silver research article will help you learn what to expect over the next 24+ months and where opportunities exist in Gold and Silver trends.
Longer-term support in Gold likely to act as an upward sloping price floor over the next 24+ months
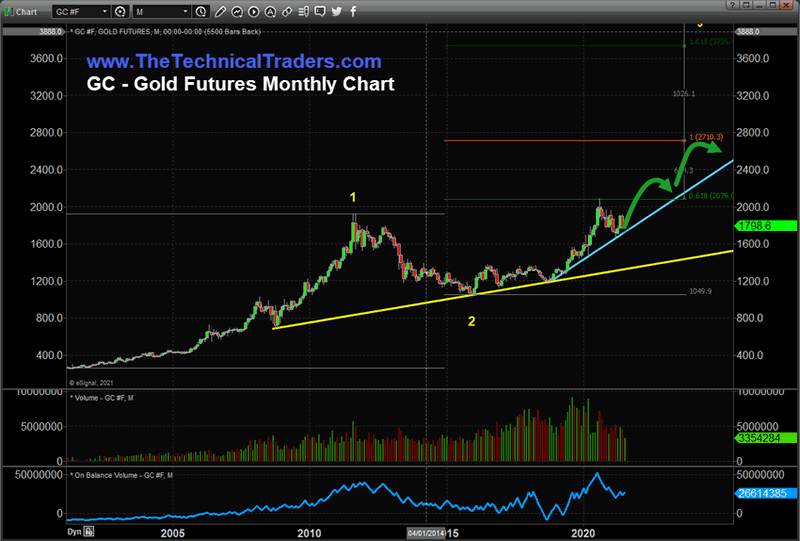
There are two key upward sloping trend lines we want to focus your attention on, on this Monthly Gold chart, below. The first, the YELLOW trend line, originates from the 2009 bottom from the Housing Crisis. The important thing to remember at this time was that the US markets were in the midst of a broad market Depreciation Cycle that started in 2001-02 and ended in 2010. The rally that was taking place before the 2000 Depreciation Cycle started was a reactionary upside price trend resulting from the end of the DOT COM bubble and the post 911 terrorist attacks. The US entered a war that pushed fear levels higher – resulting in a transitional shift in how Gold was perceived at that time.
The YELLOW trend line acts as key market support resulting in a Wave 1 & Wave 2 setup. Gold is currently rallying into a Wave 3 rally phase which my team and I believe will prompt two unique rally peaks over the next 24+months. The first with a high price near $2400 and a second with a high price near $2775. The first upward price wave will likely peak near the end of 2021 or in early 2022 and the second upward price wave will likely peak near Q3/Q4 of 2022.
Be sure to sign up for our free market trend analysis and signals now so you don’t miss our next special report!
The second upward sloping price trend line is more aggressively trending and will likely act as an immediate price floor over the next 24+ months. In other words, we expect this more aggressive CYAN trend line to continue to act as an immediate price support level pushing the next two price waves upward to our targets levels.
I’ve drawn the two expected upward price waves on this chart in GREEN Arrows. Remember, this is a Monthly Gold price chart, so each of these price waves represents 4 to 6+ months of time.
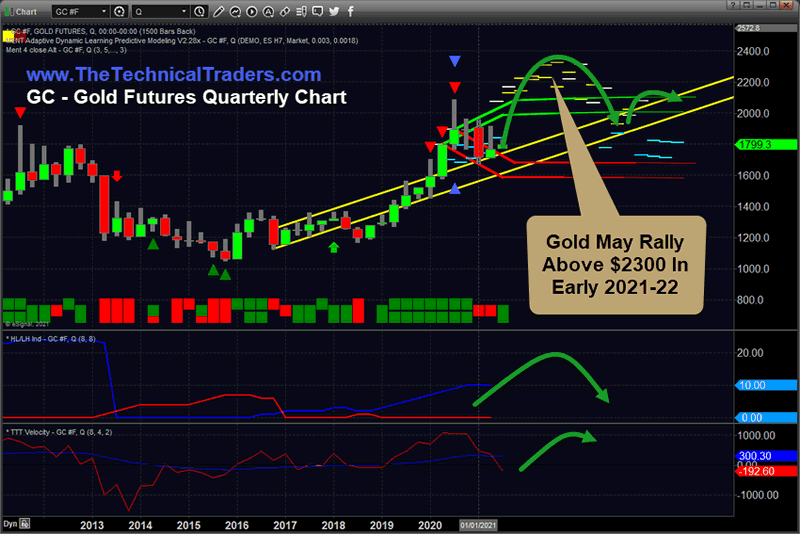
Gold Quarterly Adaptive Dynamic Learning Chart – Looking For $2500+
Our proprietary Adaptive Dynamic Learning price modeling system is showing a very clear upward arcing price advance in Gold on this Quarterly chart. It is clear to see Gold should rally into the end of 2021, reaching highs above $2100~2200 before the start of 2022, then continue to rally above $2200 into 2022. At this point, Gold will likely attempt a rally above $2400 before stalling out between $2400~$2500 near the end of 2022. This next downward price correction, after the peak, will attempt to retest the YELLOW support channel on this chart – which is very similar to the CYAN price trend line on the chart above.
The next secondary peak in Gold will likely happen in 2023. The condensed nature of this second price rally in Gold suggests the peak near $2400 may complete a minor upward wave, part of the broader upward Wave 3 structure setting up now, and prompt a minor retracement to levels near $1900 before moving higher after 2023. So, Gold traders have two to four really nice price trends setting up over the next 24+ months.
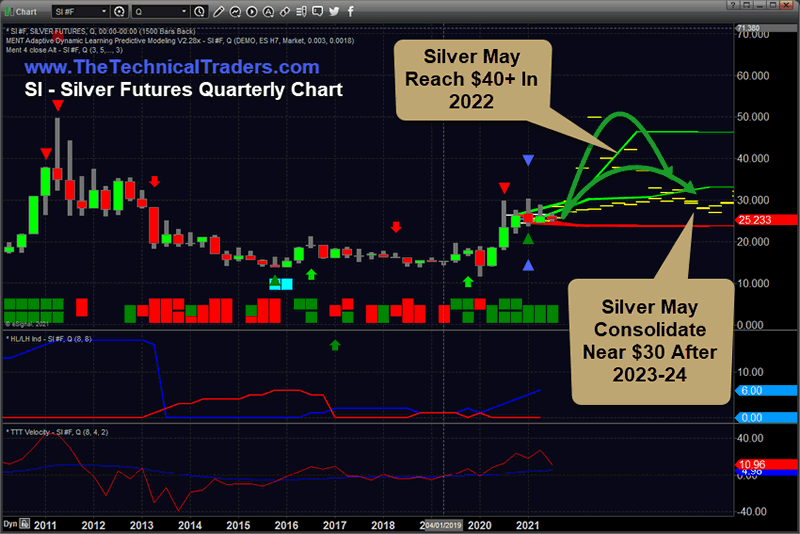
Silver Quarterly Adaptive Dynamic Learning Chart – Looking For $50+
This Silver ADL Monthly price chart highlights a very big trend that is setting up where Silver may rally above $40 to $50 near the end of 2021 or in early 2022 before moving into a sideways price consolidation phase – eventually settling near $30 to $35 in 2023~24.
What we find interesting about this ADL predictive chart is that Silver has continued to advance faster than gold over quite an extended period of time and is actually holding up a momentum/base level better than Gold over the past 8+ months. It is our belief that Silver will start to rally above $35 in Q3/Q4 2021 and may target levels above $40 before the end of 2021. The peak in Silver may happen near the end of 2021 or in early 2022, and we want to warn you that a peak level above $50 is very possibly on a washout peak type of rally.
Eventually, though, Silver will retrace back to levels near $30 to $35 and settled into another sideways price trend near the end of 2022 and throughout 2023. So, this presents another extended sideways price channel phase where Silver traders can load up on Silver while it settles into this channel before the next big rally phase.
The lack of secondary price rally in Silver, as we saw in the ADL data for Gold, suggests the secondary Gold rally phase may be very short-lived and condensed.
Either way, my team and I believe the precious metals sector is primed and ready for this next upward price trend. To help you understand the timing of these events, the bit breakout rally in Silver does not start until near the end of 2021 and carries into Q1/Q2 of 2022. The big rally in Gold will likely start in Q3/Q4 2021 and last throughout 2022 and into Q1/Q2 2023. So, based on the ADL price modeling system’s suggestions, Silver may enter an explosive price rally phase – overshooting true market boundaries, while Gold enters a more sustained and realistic price rally to levels above $2200 over the next 6 to 8+ months. Silver will peak and begin to consolidate lower while Gold holds above $2000 and continues to trend moderately higher in two separate advancing phases.
Remember, our Appreciation/Depreciation cycle phase research suggests the new Depreciation cycle phase started in 2019 and will last until 2027~2028. That means Silver and Gold will likely continue to experience multiple upward price cycle phases (advances) well into 2029~2030 before finding an ultimate peak level. We still have a long way to go before this rally in precious metals peaks.
More than ever, right now, traders need to move away from risk functions and start using common sense. There will still be endless opportunities for profits from these extended price rotations, but the volatility and leverage factors will increase risk levels for traders that are not prepared or don’t have solid strategies. Don’t let yourself get caught in these next cycle phases unprepared.
Want to know how our BAN strategy is identifying and ranking various sectors and ETFs for the best possible opportunities for future profits? Please take a minute to learn about my BAN Trader Pro newsletter service and how it can help you identify and trade better sector setups. My team and I have built this strategy to help us identify the strongest and best trade setups in any market sector. Every day, we deliver these setups to our subscribers along with the BAN Trader Pro system trades. You owe it to yourself to see how simple it is to trade 30% to 40% of the time to generate incredible results.
As something entirely new, check out my new initiative URLYstart to learn more about the youth entrepreneurship program I am developing. This is an online program of gamified entrepreneurship designed to introduce and inspire kids to start their own businesses. Click-by-click, each student will be guided from their initial idea, through the startup process all the way to their first sale and beyond. Along the way, our students will learn life lessons such as communication, perseverance, goal setting, teamwork, and more. My team and I are passionate about this project and want to reach as many kids as possible
Have a great day!
Chris Vermeulen
www.TheTechnicalTraders.com
Chris Vermeulen has been involved in the markets since 1997 and is the founder of Technical Traders Ltd. He is an internationally recognized technical analyst, trader, and is the author of the book: 7 Steps to Win With Logic
Through years of research, trading and helping individual traders around the world. He learned that many traders have great trading ideas, but they lack one thing, they struggle to execute trades in a systematic way for consistent results. Chris helps educate traders with a three-hour video course that can change your trading results for the better.
His mission is to help his clients boost their trading performance while reducing market exposure and portfolio volatility.
He is a regular speaker on HoweStreet.com, and the FinancialSurvivorNetwork radio shows. Chris was also featured on the cover of AmalgaTrader Magazine, and contributes articles to several leading financial hubs like MarketOracle.co.uk
Disclaimer: Nothing in this report should be construed as a solicitation to buy or sell any securities mentioned. Technical Traders Ltd., its owners and the author of this report are not registered broker-dealers or financial advisors. Before investing in any securities, you should consult with your financial advisor and a registered broker-dealer. Never make an investment based solely on what you read in an online or printed report, including this report, especially if the investment involves a small, thinly-traded company that isn’t well known. Technical Traders Ltd. and the author of this report has been paid by Cardiff Energy Corp. In addition, the author owns shares of Cardiff Energy Corp. and would also benefit from volume and price appreciation of its stock. The information provided here within should not be construed as a financial analysis but rather as an advertisement. The author’s views and opinions regarding the companies featured in reports are his own views and are based on information that he has researched independently and has received, which the author assumes to be reliable. Technical Traders Ltd. and the author of this report do not guarantee the accuracy, completeness, or usefulness of any content of this report, nor its fitness for any particular purpose. Lastly, the author does not guarantee that any of the companies mentioned in the reports will perform as expected, and any comparisons made to other companies may not be valid or come into effect.
Chris Vermeulen Archive |
© 2005-2022 http://www.MarketOracle.co.uk - The Market Oracle is a FREE Daily Financial Markets Analysis & Forecasting online publication.