UK Economic Crash Follows Housing, Stocks and Sterling Over the Cliff
Economics / Recession 2008 - 2010 Oct 23, 2008 - 11:41 PM GMTBy: Nadeem_Walayat

 Friday's long awaited GDP figures are expected to show an estimated GDP contraction of 0.3% for the quarter ending 30th Sept 2008. This follows the official data of zero growth for the 2nd quarter and will officially bring to an end Gordon Brown's near repetitive day in day out mantra chanted at the despatch box in his role as the chancellor of the exchequer for 9 years of having ended the boom and bust cycle. In actual fact all Gordon Brown had succeeded in delivering was a greater boom to be followed by an even more devastating bust. The key point to watch for on Friday is will a revision lower of quarter 2 GDP growth push the UK into a technical recession on the basis of 2 consecutive quarters of negative growth.
Earlier in the week, first Mervyn King the governor of the Bank of England stood up and admitted that the UK economy was heading for recession, soon followed by Gordon Brown, which strongly suggest that we will be in a technical recession as of Friday's data release.
The UK economy as I warned of several times over the past 3 months was on the verge of falling off the edge of the cliff, the economy is now in FREE FALL. Whilst economists peer out of ivory towers looking back at history and theoretical models to explain what will happen next, but what the academics fail to realise is the obvious that EVERY recession is different ! Forget the 1930's, 1970's, 1980's and 1990's recession's, this is a whole different beast that preliminary analysis suggests will follow the pattern of the fall off the edge of the cliff plunge, hit the rocks, bounce and then plunge on towards the sea bed as derivatives deleveraging deflation gives way to money printing stagflation.
UK Unemployment Soaring
UK unemployment as measured by the labour market survey surged to 1.79 million, up 164,000 for the quarter to July 2008, which clearly does not take into account the economic meltdown since August 08, nor the subsequent financial sector crash that witnessed bank after bank go bust and falling into the arms of the state or state sponsored rescue packages both of which are resulting in huge job losses in the financial sector.
The Market Oracle forecast is for UK unemployment to rise to 2.5 million by April 2010 as the below graph illustrates.
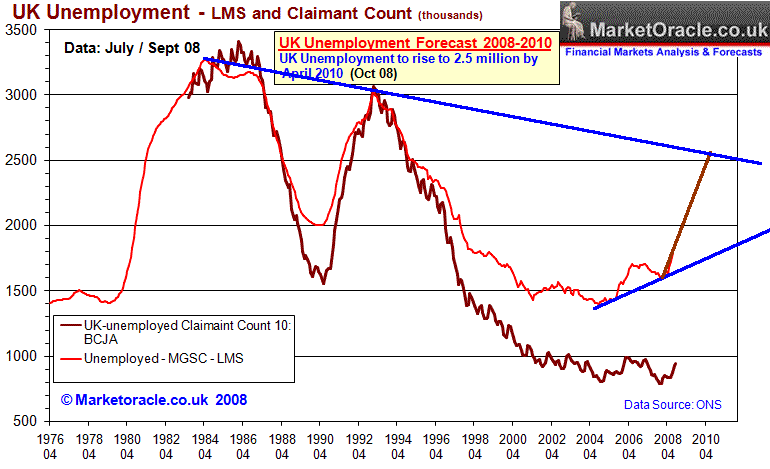
Soaring unemployment is highly deflationary which supports the view that the economic crash will not abate for at least 3 quarters no matter what measures the government adopts.
UK Interest Rate Panic Cuts
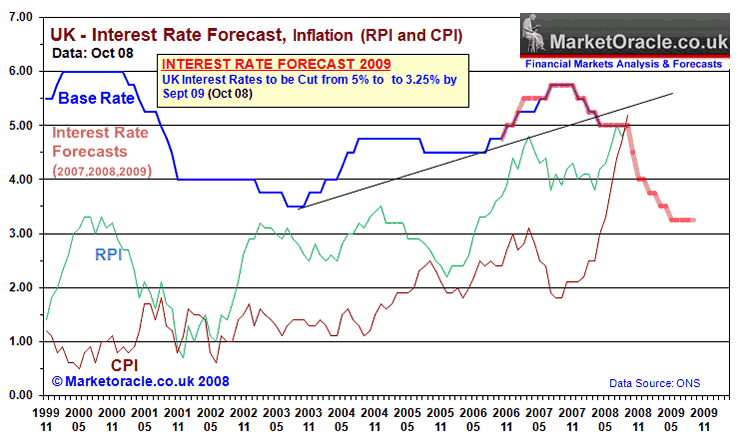
The existing interest rate forecast is for deep PANIC cuts in interest rates from 5% to 3.25% by Sept 2009. The next scheduled cut is for 0.5% in November 2008. My analysis correctly arrived at the conclusion as long as 6 months ago that the Government would force the bank of England to abandon inflation target and cut interest rates regardless. - UK House Prices Tumbling- Interest Rate Conundrum
This makes the projected trend beyond September 2008 harder to ascertain at this point in time, due to the possibility that the Bank of England may be forced to abandon the 2% inflation target in favour of measures to boost a faltering UK economy ahead of a UK general election. This suggests that we may see negative interest rates in the UK, i.e. the UK base rate being cut to below the rate of inflation as measured by the RPI inflation measure.
Given the degree of panic and uncertainty we may even see a further panic cut in UK interest rates before Novembers MPC Meeting.
UK Housing Market Crash
The Halifax's house price data shows that the housing market crash continued to accelerate into August, by plunging by 1.7% that saw another £3000 wiped off house prices following the £3,300 write off for July to stand at down 12.8% on the year to August (on a non seasonally adjusted basis). UK house prices have now fallen by more than 9% since April (taking sept into account).
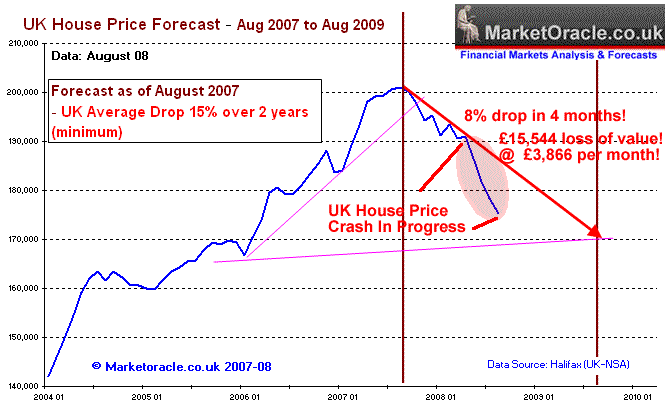
The crash in UK house prices has been forewarned by myself several times during the past 12 months, right from before the housing market peaked in August 2007 and with the explicit warning in November 07 of a housing market crash starting in April 08, which was elaborated upon the article at the beginning of April 08 - UK House Prices Plunge Over the Cliff and over the summer months UK House Price Crash In Progress!
The existing forecast for a minimum fall at the rate of 7.5% per annum as of August 2007 is now due for imminent update to extrapolate a trend for UK house prices for at least 2 years forward.
Sterling Crash
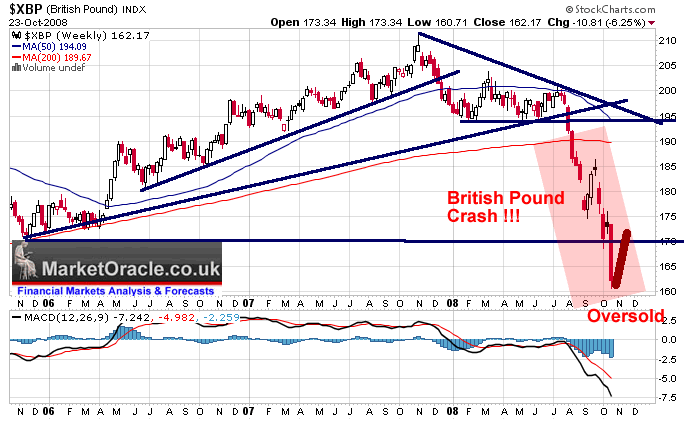
The crash in the British Pound of 24% from a peak of £/$2.11 to £/$1.60 is highly inflationary as commodities and much of international trade is generally priced in US Dollars, therefore over the last 2 months the fall in sterling will tend to feed through into higher forward inflation about a year from now.
The US Dollar continues to benefit from scared capital seeking shelter in US Dollar short-term money market funds and treasury bonds. My analysis of August 2008 ( The US Dollar Bull Market) implied that the US Dollar had now embarked on a bull market that was destined to reach to USD 90 from a low of 71. However the credit chaos complicates the picture somewhat as we enter into a new era of less of free markets and more government intervention, therefore the currency markets are far more at the mercy of ever increasing desperate government actions to prevent economic contraction.
Meanwhile for sterling, barring horrendous GDP data on Friday, sterling technically looks oversold so a rally from the current £/$1.61 to £/$1.70 is highly probable following a volatile morning session.
UK Retail Sales Collapsing
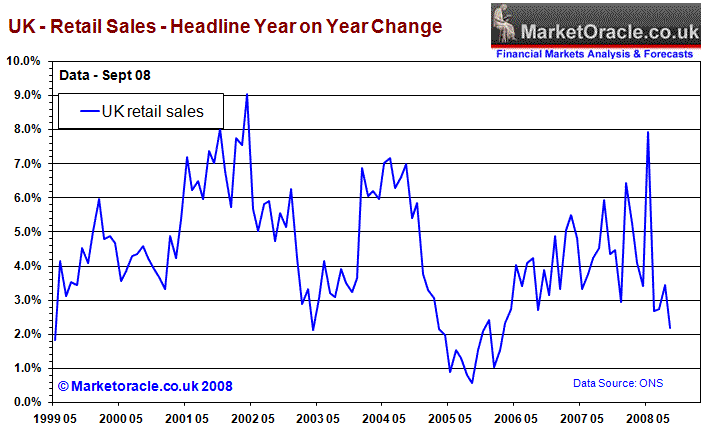
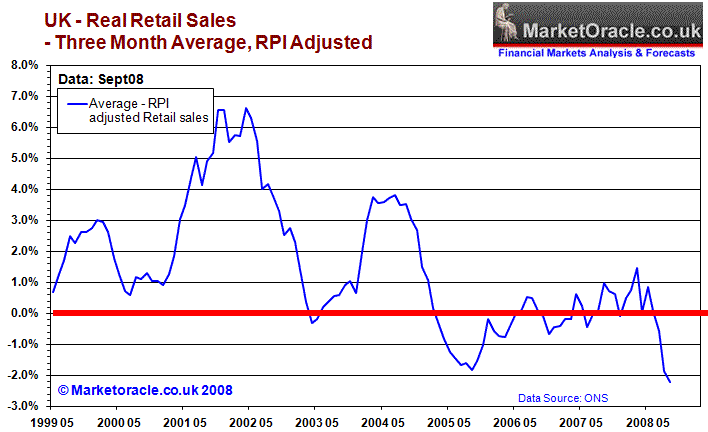
Whilst mainstream commentators have gyrated between boom and bust monthly data releases, the trend adjusted retail sales data has consistently shown that the retail sector has been experiencing extreme distress for some time, which has not been reflected in the official series that still paint a far rosier picture than that which is actual being experienced by retailers as the below graphs illustrate.
UK GDP Growth Forecasts
The forecast for the UK economy made in December 2008 was for the economy to end 2008 with GDP growth of 1.2%, this compares against forecasts by many financial institutions including the IMF and OECD for growth for 2008 of between 2% and 2.5%, and at the time seemed overly pessimistic ( Dec 07 ).
The in-depth UK GDP growth forecast or should I say GDP contraction forecast for 2009 and beyond will be generated over the next 2 weeks, subscribe to our always free newsletter to get this and other scheduled forecasts in your inbox on the day of publication.
By Nadeem Walayat
http://www.marketoracle.co.uk
Copyright © 2005-08 Marketoracle.co.uk (Market Oracle Ltd). All rights reserved.
Nadeem Walayat has over 20 years experience of trading, analysing and forecasting the financial markets, including one of few who both anticipated and Beat the 1987 Crash. Nadeem is the Editor of The Market Oracle, a FREE Daily Financial Markets Analysis & Forecasting online publication. We present in-depth analysis from over 150 experienced analysts on a range of views of the probable direction of the financial markets. Thus enabling our readers to arrive at an informed opinion on future market direction. http://www.marketoracle.co.uk
Disclaimer: The above is a matter of opinion provided for general information purposes only and is not intended as investment advice. Information and analysis above are derived from sources and utilising methods believed to be reliable, but we cannot accept responsibility for any trading losses you may incur as a result of this analysis. Individuals should consult with their personal financial advisors before engaging in any trading activities.
Nadeem Walayat Archive |
© 2005-2022 http://www.MarketOracle.co.uk - The Market Oracle is a FREE Daily Financial Markets Analysis & Forecasting online publication.


