


Bitcoin Rockets In Preparation For Liftoff To $100,000
Currencies / Bitcoin Oct 12, 2021 - 02:32 PM GMTBy: Submissions

By Jason Appel - In my September article updating expectations and possibilities for Bitcoin to reach $100k, three paths were discussed that detail various perspectives for the near-term in Bitcoin (BTC-USD) on its way to $100k.
In this article, we will review the various paths presented in the September article, and reconcile the present action to find which of the scenarios appears most likely.
From the September article:
Three potential regions to catch price on the coming drop:
Black Count: In this count, we consider the prospect that the lows are in. Pullbacks are buying opportunities. Based on the low and high of the rally structure in question, our first region to watch ranges from approximately $36k-$42k. Should price form a symmetrical 3 wave move from the September 6th high into the aforementioned region and strongly bounce, we will have some additional evidence that the decline is complete and price is on its way to $100k+. Confirmation of this count displayed in black notation will ultimately confirm by price maintaining above $36k and breaking out above the September 6th high. Alternatively, should the price make a sustained break below the $33,600 region, we have a strong signal that lower lows are incoming.
Purple count: This count comes into play if price breaks below $33k. Should BTC break below $33k, it will need an immediate rally back north of $41k to avert the then-likely prospect of the lower low. If BTC is going to head down to lower lows, this current decline off the September high should form a 5 wave move. The symmetrical or measured move from the April highs targets $23,900, just undercutting the $24k support region. Based upon the 5 wave structure supposed for this move, after any drop below $33.6k, price should ideally remain below $38,700 on any subsequent corrective rally prior to finishing the structure to a lower low beneath that made in July.
Red Count: Crash! Price follows the form of the purple count, and breaks through $33k but in this case sellers have the momentum to send price resoundingly below the $24k region. The next support region below sits in the $17k-$20k region.
What has happened?
As expected, Bitcoin pulled back. BTC formed a temporary top on 9/18 in the $48,800 region and broke down to the $39,600 region striking a low of sorts on 9/21. Since then, BTC has formed a rally, which is now approaching the September high.
How does this fit within the prospective paths?
Red and purple counts: As the red count portended a crash, nothing about the recent action resembles the expectations of this path. Similarly, regarding the purple path, while this perspective has not been officially ruled out, it has become unlikely and I'm inclined to disregard it. Sellers were unable to breach even the 50% retrace of the rally off the July low and now the September highs are being challenged. Furthermore, the structure of the drop being clearly corrective is not at all suggestive that price has intentions of making new lows below the summer decline.
Black count: Price has followed this path almost to perfection since the publication of the September article. The drop landed right in the middle of the support region and has now rallied nearly all the way back to the September high.
Let's take a look at the action on a smaller time frame operating from the black count.
BTC has formed a 3-wave rally from the 9/21 low, and while the action has been very bullish, the black count has yet to prove that any moves sub $40k (before reaching $100k) are in hindsight.
In order to prove that price is very unlikely to breach the 9/21 low, the first two conditions are:
A rally exceeding $49.6k, the .382 extension off the 9/21 low.
A complete 5-wave move.
So far, the first condition has been met and the second condition is getting close.
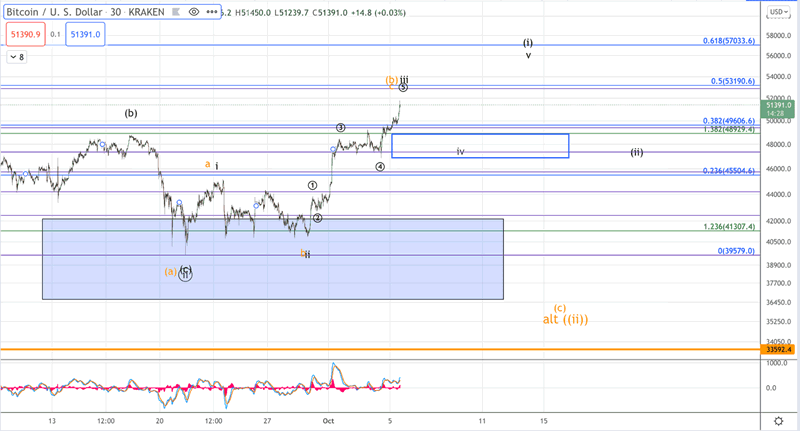
We have 3 waves up so far that's attacking the 1.764 extension of the i-ii. As such, one more pullback and a higher high, i.e., a iv-v, is needed to complete 5 waves up for wave (i) of circle iii. Should price follow through as shown according to the black count in the accompanying micro chart, that development will strongly favor a lasting low in place at the 9/21 lows, and subsequent pullbacks can be seen as buying opportunities.
Support for the wave (iv) pullback is in the $46.4k-$48.8k region. A successful test of this region followed by one more high can fulfill the wave (i) of circle iii off the 9/21 low.
Alternatively, should price fail to hold support for the wave (iv) and instead break below the $46.4k region resoundingly without completing 5 waves up, we need to consider other perspectives. As shown on the micro chart in blue, we'd have to consider the current rally a (B) wave with a (C) wave down to come, expected to find support in the $36k-$39k region. So long as $33k holds, we'll still be tracking the black count from the previous article, albeit with a slight modification. Below $33k would cause us to bring back the purple/red perspectives.
Assuming the black count gets the 5 waves up, what levels can be seen over the next several weeks and months?
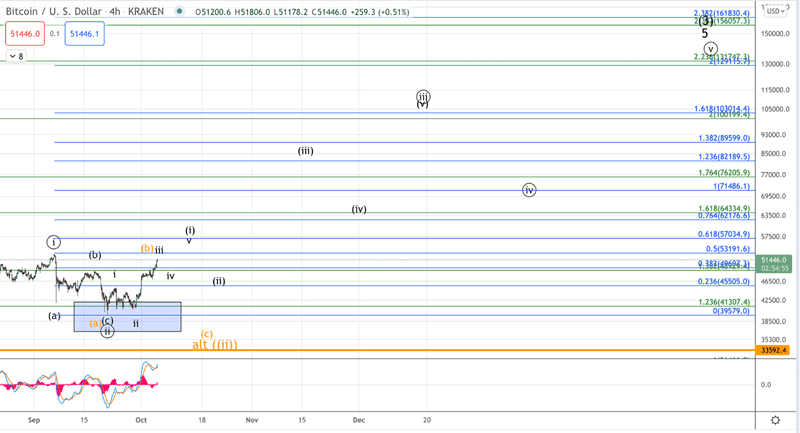
Based on the current micro-structure, a complete 5-wave rally for wave (i) is likely to target the $57k region. From there, $45k-$52.5k will be the support region for the (ii). From the completion of the next smaller degree wave (ii), expectations are for price to launch in the wave (iii) of circle iii, which should be considered the "heart" of the move off the July lows. Wave (iii) targets $82k and all of circle iii targets over $100k.
To review, the thesis that comes into effect upon completion of 5 waves up off the 9/21 lows: 9/21 has struck a lasting bottom and a move is underway to $100k+. Pullbacks can be bought with a stop below the 9/21 low. Ideally, BTC should not even break back below the $43k level.
For those looking to fill out their positions for the next launch at the moon, entries in the aforementioned $45k-$52.5k region following the completion of 5 waves into the $57k region, with stops below the 9/21 low offer excellent risk/reward to trade for $100k+.
Jason Appel is an analyst at ElliottWaveTrader.net where he co-hosts the Cryptocurrency Trading service and hosts the site's beginners forums and webinars.
© 2021 Jason Appel - All Rights Reserved
Disclaimer: The above is a matter of opinion provided for general information purposes only and is not intended as investment advice. Information and analysis above are derived from sources and utilising methods believed to be reliable, but we cannot accept responsibility for any losses you may incur as a result of this analysis. Individuals should consult with their personal financial advisors.
© 2005-2022 http://www.MarketOracle.co.uk - The Market Oracle is a FREE Daily Financial Markets Analysis & Forecasting online publication.