


Gold Hits New Bear Market Low
Commodities / Gold & Silver Oct 25, 2008 - 06:45 PM GMTBy: Merv_Burak

 New bear market lows in gold but not really confirmed by the indicators. Are we in for a rally here? One would be nuts to predict with any certainty. However, we can confirm where we are, if not where we are going.
GOLD : LONG TERM - That $750 P&F projection mentioned last week didn't stand a chance. By the end of the week the P&F chart dropped as low as the $690 unit before rebounding during Friday up to the $750 unit. Now what? The rebound is nice but at this point does not imply a rally of any significance in progress. So we still have the $630 and possibly the $480 levels to look forward to.
Gold has dropped less than 30% from its earlier high to Friday's close while stocks have been hit hard and most are well beyond 60% declines. From past gold and gold stock bear markets there could still be a lot of downside still ahead. Unfortunately, to try and really predict gold is somewhat risky in the present global environment. With the global financial turmoil one should have seen gold go through the roof (maybe it still will) and the U.S. dollar drop like a rock (maybe it still will) but at the present time the actions are just the opposite. Go figure!
Although the long term P&F chart dropped several units down and then a few up, the action has not changed any of the P&F analysis of late so let's go to the normal chart and indicators. Gold has moved well below its negative sloping long term moving average line. Its momentum indicator remains in its negative zone below its negative trigger line. The volume indicator remains below its long term negative sloping trigger line. Nothing here to change the rating, it remains BEARISH .
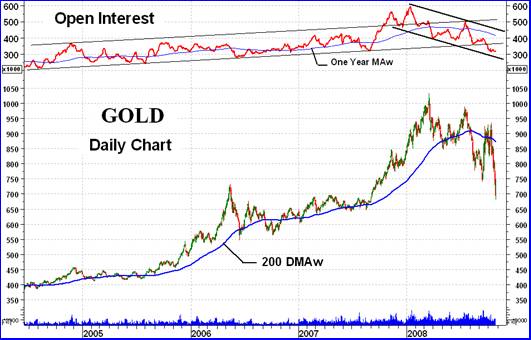
Some months back, oh maybe a year or so, I mentioned the open interest in gold. My open interest data only goes back to mid-2004, prior to that it is unreliable. What the open interest was showing was a well established trend moving gently higher. This trend took a sharp roller coaster ride over the past year. First it zoomed upwards well beyond any previous rally zoom. It then took a dive. Although it came back to that long established up trend line in early August and tried to once more turn around and go higher this was not to be. After a month of lazy sideways movement the open interest, for the first time in many years, went through that up trend line and has established a down trend. You can see the well defined down trending channel on the chart. For the first time the 260 day moving average line (the One Year MAw line) of the Open Interest has turned decisively downwards.
So, what does this mean?
Hell if I know. I'm just curious because of the well defined technical patterns being made by the Open Interest plot. Its meaning I have not really been able to decipher relative to gold or gold stocks. The Open Interest downward action seems to be about twice as sharp as its previous upward action. This might indicate that the bear market in gold will be a lot shorter than the previous bull market was. There doesn't seem to be any concrete relationship between the peaks and valleys in the Open Interest and gold except that on the way up the valleys in the Open Interest did seem to be at the bottom of the gold price trends, just before a gold rally.
I will leave it to others to determine if there is any mysterious relationship between the two movements. For now this is another interesting space filler.
INTERMEDIATE TERM
Gold has made it to a new bear market low this past week. Looking at the chart we had two peaks and two valleys and now a third valley. This seems like a bearish Elliott Wave pattern but my knowledge with the Elliott Wave Theory is limited so I wouldn't go into it, although if it is it just might be approaching the end of the pattern and ready for a reversal. As far as the normal indicators are concerned, gold remains below its negative sloping moving average line and the momentum indicator remains in its negative zone below its negative sloping trigger line. The volume indicator seems to be trying to go sideways but remains below its negative trigger line. All in all, nothing here to change the intermediate term rating. It remains BEARISH.
SHORT TERM
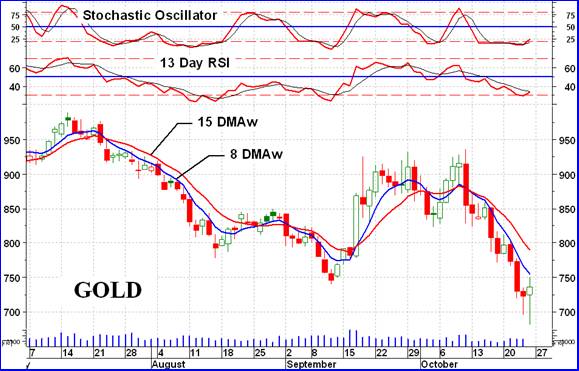
Although everything on the short term side is still negative there are some signs that gold has gone down too far too fast. Thursday's action had gold closing near the high of its daily trading range. Friday started rough with gold dropping sharply (as opposed to a rally indication from the previous day's action) but then recovered at the day's end to close once more near its high point of the day. This does suggest that barring any global turmoil during the week-end gold
should rally over the next few days. The short term momentum indicator is also bouncing off its oversold line and just about to cross its trigger line to the up side. It is, however, still in its negative zone. Gold itself remains below its short term moving average line and the very short term moving average line remains below the short term line. All of these indicators leave us with a present rating that is still BEARISH .
SILVER
Silver did add on another unit on the down side to the P&F chart of last week but ended the week down only slightly. Although silver has been trending lower over the past few weeks the momentum and volume indicators have been basically in a lateral trend, both refusing so far to make new lows to confirm the silver lows. For now this is a positive sign that maybe the silver plunge has ended for a while. Any turn around has not yet started but that could be in not too many days. The one day reversal type of action noted for gold is not as evident for silver although one might take Friday's action as such.
PRECIOUS METAL STOCKS
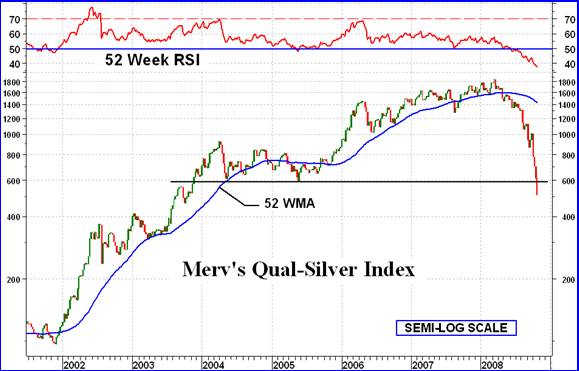
Over the past few weeks I have been showing the performance of a variety of precious metals Indices. Today we have the Merv's Qual-Silver Index. This Index of 10 of the largest silver mining stocks shows the average performance of these stocks since the start of their bull market in late 2001. The recent reversal of trend was well broadcast by the chart and indicators. Here I have been showing very long term indicators. The Index fell below its moving average line and the line turned decisively downwards while the Index was still in its 1400 range. The momentum indicator had moved into its negative zone well before this. The weakness in the Index move into new highs over the past year was highlighted by the inability of the momentum indicator to move anywhere near its previous highs. The long simmering bearishness of the Index over the past year is represented by the viciousness of the plunge over the past half year. The Index is now where it was back in 2003. Five years wiped out in barely a half a year.
Although it is generally expected that a new bull market should take hold again the big question is when will it start and from what level. I would expect some significant sideways movement before any new bull market takes hold. So, one might just as well sit on the sidelines and relax.
NO COMMENTARY NEXT WEEK
I will be heading off to Toronto for a presentation at the E*Trade Canada Technical Analysis Summit and will be unable to do my weekly commentary. I will be back the following week. I hope to see some of you at the Summit and welcome your input and discussions. For information about the Summit go to the Canadian Society of Technical Analysts site at www.csta.org .
Merv's Precious Metals Indices Table
Let's call it another week.
By Merv Burak, CMT
Hudson Aero/Systems Inc.
Technical Information Group
for Merv's Precious Metals Central
For DAILY Uranium stock commentary and WEEKLY Uranium market update check out my new Technically Uranium with Merv blog at http://techuranium.blogspot.com .
During the day Merv practices his engineering profession as a Consulting Aerospace Engineer. Once the sun goes down and night descends upon the earth Merv dons his other hat as a Chartered Market Technician ( CMT ) and tries to decipher what's going on in the securities markets. As an underground surveyor in the gold mines of Canada 's Northwest Territories in his youth, Merv has a soft spot for the gold industry and has developed several Gold Indices reflecting different aspects of the industry. As a basically lazy individual Merv's driving focus is to KEEP IT SIMPLE .
To find out more about Merv's various Gold Indices and component stocks, please visit http://preciousmetalscentral.com . There you will find samples of the Indices and their component stocks plus other publications of interest to gold investors.
Before you invest, Always check your market timing with a Qualified Professional Market Technician
Merv Burak Archive |
© 2005-2022 http://www.MarketOracle.co.uk - The Market Oracle is a FREE Daily Financial Markets Analysis & Forecasting online publication.