Silver $100 – Nothing Has Changed
Commodities / Gold and Silver 2022 Mar 14, 2022 - 09:43 PM GMTBy: Kelsey_Williams
In retrospect, nothing much has changed since I published my original article $100 Silver Has Come And Gone in October 2019.
The price is higher than it was at the time the article was written, and that is certainly positive. However, the net change since then does not alter the fundamental arguments stated in the original article. Let’s review the salient points now.
SILVER PRICE HISTORY – SHORT REVIEW
Projections for $100 silver date back more than forty-two years to early 1980. Silver had posted an intra-day high of $49.45 oz. in January 1980 and was consolidating at lower prices closer to $36.00 oz.
The monthly average closing price for silver in January 1980 was $35.75 oz. and in February it was $36.15 oz.
After that, it was all downhill. Thirteen years later, in 1993, silver was priced at $3.36 oz. and continued to trade below $5.00 oz. for eight more years until 2001.
We know that silver recovered and regained the lost ground, rising back to $48.50 oz. in August 2011. The monthly average closing price in July 2011 was $40.10 oz and in August it was $41.76.
The numbers in 2011 ($40-41.00 oz.) were somewhat better than in 1980 ($36.00an s oz.) but it took silver thirty-one years to get there. Also, silver’s intra-day price peak in 2011 did not exceed its 1980 intra-day peak.
Several years later the silver price dropped to under $14.00 oz., in January 2016 and again in November 2018. At the time (November 2019) I wrote the original article, silver had recovered some lost ground and had traded above $18.00 oz.
SILVER PRICE ACTION SINCE NOVEMBER 2019
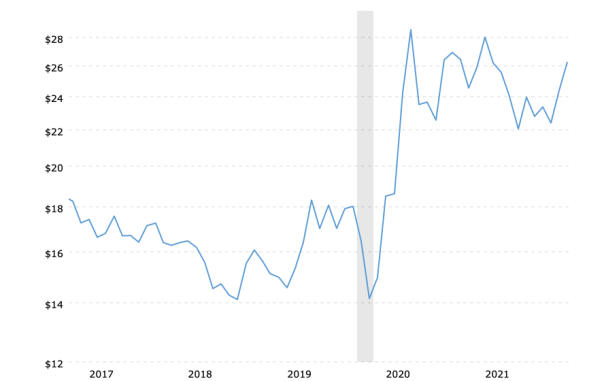
After a recovery peak above $18.00 oz. in early 2020, silver fell victim to the all-asset slide that occurred in March-April 2020, dropping briefly below $12.00 oz. before moving to a high of $29.26 oz. later that year.
Silver flirted with the $30.00 level again in May 2021, then dropped down to $21.49 in December 2021. The price of silver is now at $25.83 oz.
Here is a chart (source) showing silver price action for the past five years…
Silver Prices – 5 Year Historical Chart

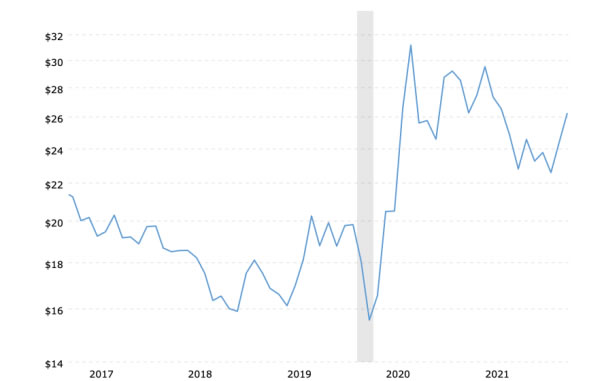
Here is the same chart with silver prices adjusted for inflation…
Silver Prices (inflation-adjusted) – 5 Year Historical Chart

Up until its recent upward spike, the silver price was in an apparent downtrend since its peak in August 2020.
That downtrend is more pronounced in the inflation-adjusted chart. The upward spike this year could be just a temporary reversal within a bigger downtrend. Only time will tell.
The effects of inflation are a drag on nominal prices which can be seen by looking at the price scales on the left in both charts.
The previous price peak of $29.00 oz in August 2020 is now equivalent to $31.00 oz in today’s dollars.
SILVER PRICE HISTORY LONG TERM
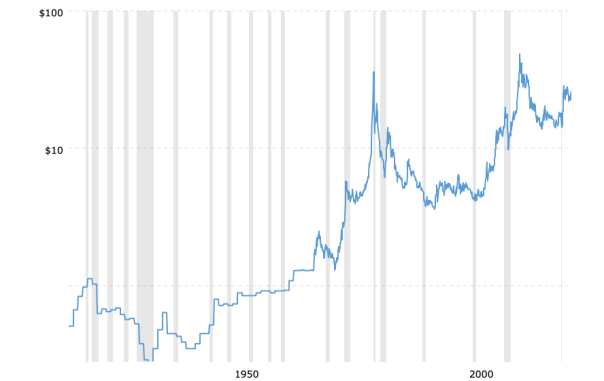
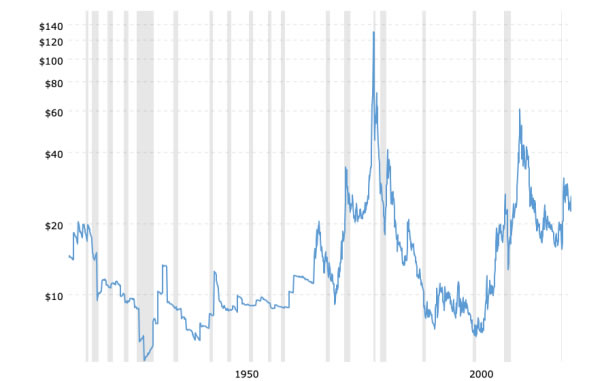
The effects of inflation are even more pronounced over time. Here are two more charts (same source as before)…
Silver Prices – 100 Year Historical Chart

Silver Prices (inflation-adjusted) – 100 Year Historical Chart

We mentioned earlier that the peak monthly average closing price for silver in 1980 was $36.00 oz. and in 2011 was $41.00 oz. That is a cumulative total increase of only thirteen percent; and it took thirty-one years to happen.
What is much worse, though, is that the inflation-adjusted total return for silver over that thirty-one year period is negative sixty percent (-60%) on a peak to peak basis.
SILVER – WHERE ARE WE NOW?
Using the current silver price, which is down almost fifty percent since August 2011, silver has lost eighty percent since February 1980.
Using the monthly average closing price ($36.00 oz.) cited and shown on the chart immediately above, and allowing for the effects of inflation, the silver price needs to be at $130.00 oz. today – just to match its $36.00 oz. price in February 1980.
If we calculate similarly using the 1980 intraday high of $49.45 oz., then silver needs to be $180.00 oz today – again, just to match that 1980 peak price.
FACTS AND CONCLUSION
- Silver has yet to exceed its 1980 intraday high in nominal terms.
- Silver is currently fifty percent lower than its 1980 peak in nominal terms and eighty-five percent lower in real (inflation-adjusted) terms.
- Each inflation-adjusted peak in silver since 1980 is lower that the previous one.
- If the silver price were at $100.00 oz. today, that is still a net loss of forty-five percent in real terms since 1980.
Holding some silver coins for possible use in the event of a complete collapse in the US dollar makes sense. Other than that, buying silver as an investment has proven itself historically to be a losing bet in both nominal and real terms. (also see Is Silver Really Cheap; And Does It Matter?)
Kelsey Williams is the author of two books: INFLATION, WHAT IT IS, WHAT IT ISN’T, AND WHO’S RESPONSIBLE FOR IT and ALL HAIL THE FED!
By Kelsey Williams
http://www.kelseywilliamsgold.com
Kelsey Williams is a retired financial professional living in Southern Utah. His website, Kelsey’s Gold Facts, contains self-authored articles written for the purpose of educating others about Gold within an historical context.
© 2022 Copyright Kelsey Williams - All Rights Reserved Disclaimer: The above is a matter of opinion provided for general information purposes only and is not intended as investment advice. Information and analysis above are derived from sources and utilising methods believed to be reliable, but we cannot accept responsibility for any losses you may incur as a result of this analysis. Individuals should consult with their personal financial advisors.
© 2005-2022 http://www.MarketOracle.co.uk - The Market Oracle is a FREE Daily Financial Markets Analysis & Forecasting online publication.


