Why APPLE Could CRASH the Stock Market!
Stock-Markets / Stock Market 2022 May 21, 2022 - 05:54 PM GMTBy: Nadeem_Walayat
Dear Reader
The earnings bloodbath materialised, that started on Tuesday with Google trading down to $2265, and ended on Friday with Amazon plunging down to a new low of $2425. With the two 'cheap' stocks Qualcom and Facebook rallying strongly post earnings. Virtually everything went according to the script of my last article i.e. "we could see Amazon trade to well under $2500, probably into the $2450 to $2300 support zone". The only odd one out was Apple that refused to budge much from $160, where my expectations remain is headed to below $142.
Stocks Bear Market Current State
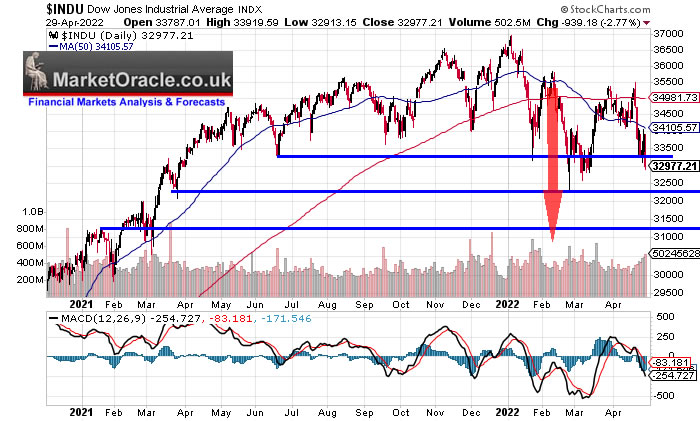
My big picture remains as I have been iterating for the past 3 months in that I expect the Dow to target a volatile trend to below 31k.
5th Feb 2022 - We are in for a volatile trend with a downwards bias for much of 2022, as I wrote to expect on the 5th of Dec 2021 accompanied by revised trend forecast graph.
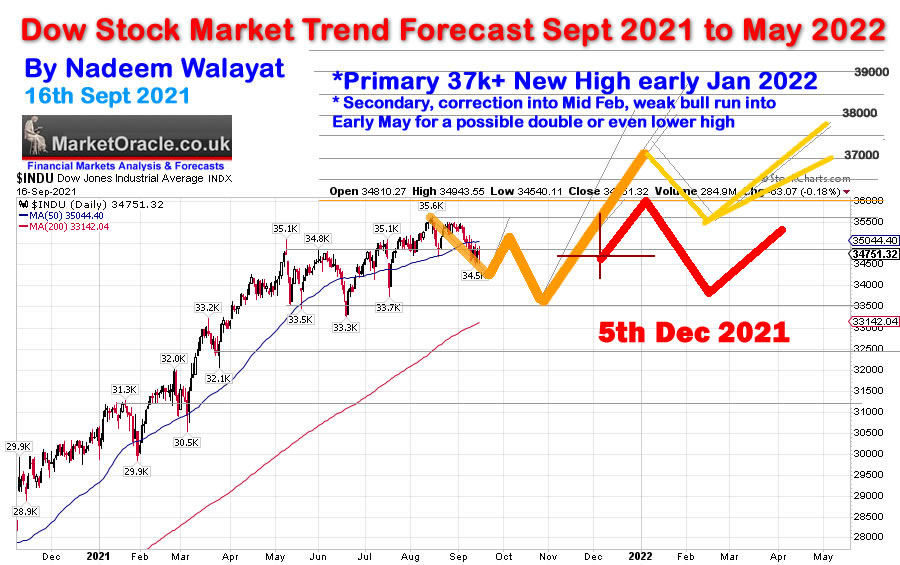
Following which my expectations were for the Dow to target a trend to $31k as illustrated below -
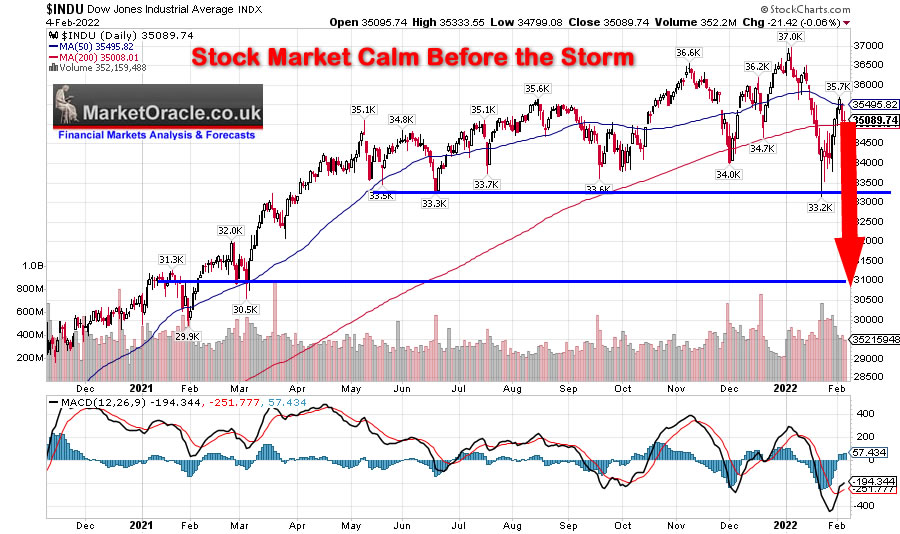
The Dow closed at 32977, the bull market peak was 37k, which currently puts the Dow at -10.8%. The target for the low is 31,000 to 29,000 for a 16.2% to 21.6% peak to trough bear market. So the Dow currently stands at 6% to 14% above it's final low where my expectations are for the final low to be nearer to 29k than 31k and that is the INDEX risk of accumulating stocks at a Dow deviation of 10.8% from it's high i.e. for an index draw down of 6% to 14% from it's current price. The only thing that is not clear is WHEN the Dow will bottom.
In terms of immediate price action then the Dow has done nothing to suggest that the trend I forecast last last week to Dow 32k is not going to soon become manifest i.e. that the Dow is targeting a trend to 32k. for a new bear market low.
In the meantime I am obviously seeking far greater deviations than that for the Dow to accumulate select AI tech stocks at as and when opportunities arise as the stealth bear market cycles through individual stocks just as we witnessed last week.
Note: The information provided in this article is solely to enable you to make your own investment decisions and does not constitute a personal investment recommendation or personalised advice.
This analysis (Why APPLE Could CRASH the Stock Market!) was first made available to patrons who support my work.So for immediate first access to ALL of my analysis and trend forecasts then do consider becoming a Patron by supporting my work for just $4 per month. https://www.patreon.com/Nadeem_Walayat.
Latest analysis include -
- AI Tech Stocks Current State, Is AMAZON a Dying Tech Giant?
- The CRACK UP BOOM! Implications for Stocks, Housing. and Commodities, Silver Potential
- Why APPLE Could CRASH the Stock Market!
AI stocks Portfolio
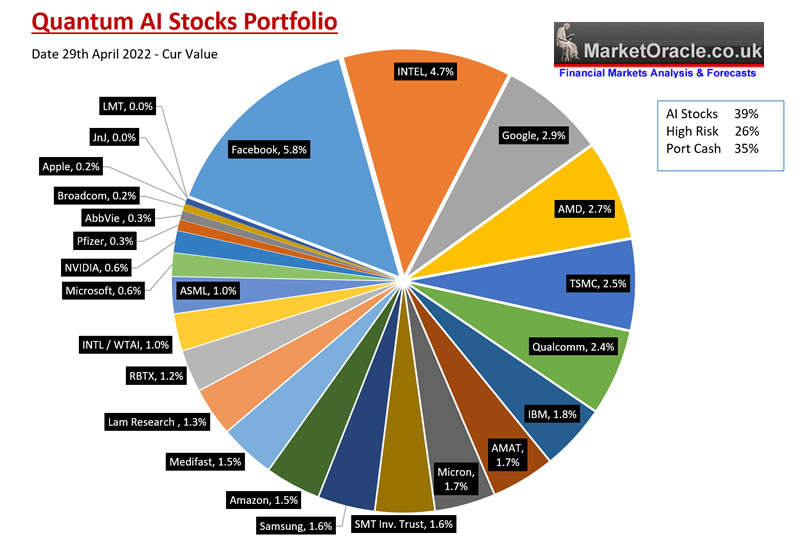
I continue to get the buying job done by catching the falling knifes through a string of small buys. Breakdown of my exposure stands at AI stocks 39% (36.7%), High risk 26.1% (25.1%), with portfolio cash falling to 35% (38.2%). The largest increase in exposure during the week was in Amazon from 28% to 39% and Google up from 42% to 47%. Remember folks all this is being done without the benefit of hindsight. Whilst the EGF indicator has started to FLASH a RECESSION WARNING as it turns negative on virtually every reporting stock except Qualcom, thus proving a useful indicator, especially take note of Amazons -68% reading which instantly warns the stock the price is nowhere a bottom even after last weeks drop to $2485.
In terms of my long standing buying levels then Amazon finally fulfilled it's level of $2600 which has been in force since November 2021 when the stock price was trading at $3600. I am sure at the time $2600 seemed like an impossible pipe dream but here we are 6 months later job done! And to think there were many fools at the time promoting Amazon as a buy at $3700, so it's no wonder most who remained invested in Amazon on the basis of poop analysis where on Friday were probably weeping at $2485 closing price.
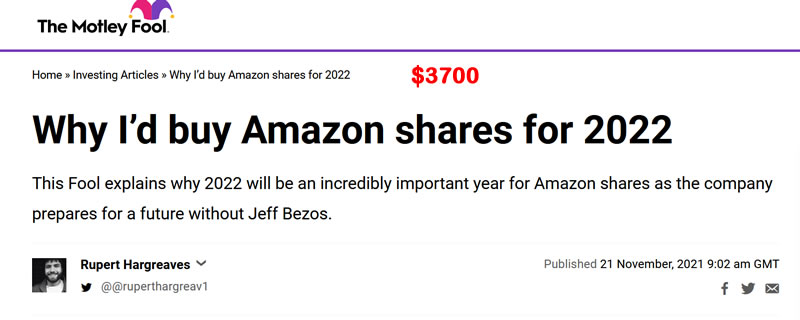
I may be wrong but it appears to me that ALL stocks are ALWAYS a BUY with Motley Fool! A case of the always blue sky's ahead to maximise sales and marketing of services and so as to get the investing lemmings onboard.
Now only long standing buying levels for Apple, Broadcom and IBM remain pending, hence why I have no new exposure to any of these stocks whilst IBM exposure dates back several years.
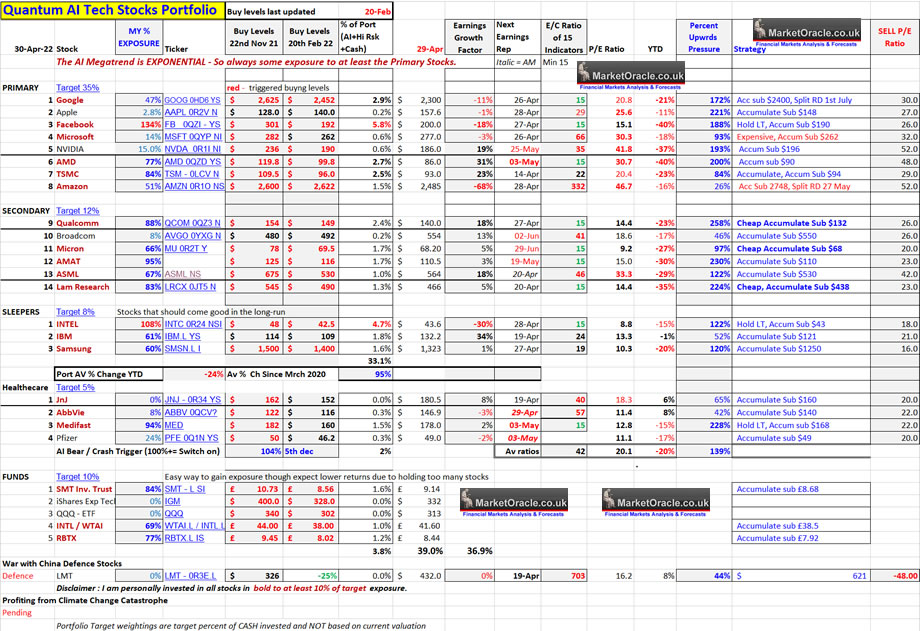
Big Image - https://www.marketoracle.co.uk/images/2022/Apr/AI-tech-stocks-table-29-4-22-BIG.jpg
And here's the pie chart breakdown of my holdings in response to last weeks buying.
High risk stocks portfolio (8th April).
I continue to accumulate into NEW High Risk stocks each time I see them trade to new lows..
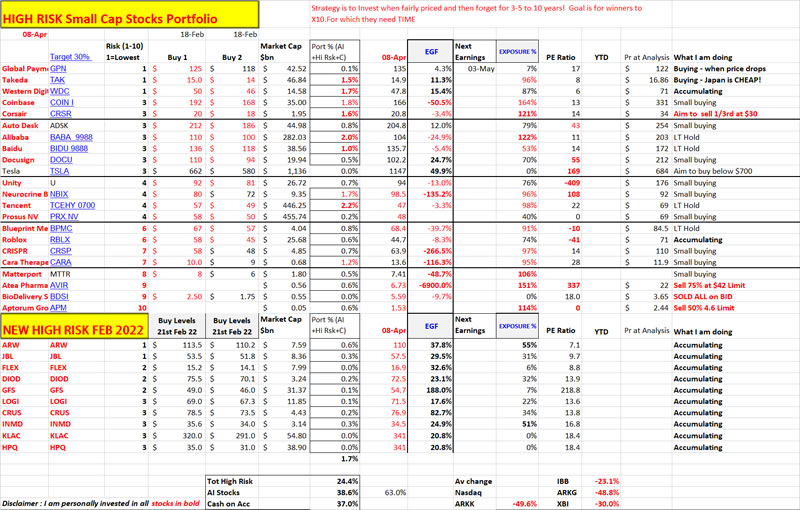
Big Image - https://www.marketoracle.co.uk/images/2022/Apr/NW-High-Risk-Stocks-APR-8-BIG.jpg
The primary focus of this article is on the four major tech stocks that reported earnings last week that could drive the S&P sharply lower.
Amazon $2485 : PE 46.7: EGF -68% : EC 332
Amazon Crashed 10% on BAD earnings as Amazon delivered an EPS of -$7.56 vs $8.73 expected, why were Amazon's earnings so bad? It's because the US is going into significant economic slowdown that increases the odds of a recession being declared this year!. Amazons PE before earnings was 43.7, AFTER earnings and the price plunge the PE is 46.7, That's right AMAZON is MORE EXPENSIVE AFTER the PRICE DROP THAN BEFORE! Pay attention here and learn a valuable lesson not to just buy a stock because it drops! For amazon to trade at a PE of 43.7 the stock would need to drop to $2325.
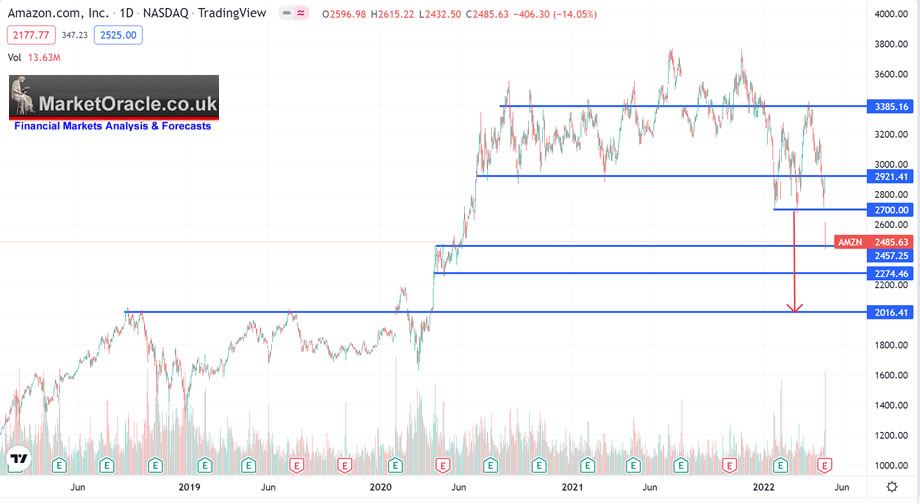
How low could Amazon fall?
I would not be surprised if Amazon trades down all the way to to $2000 so there is plenty more downside in this tech giant to weigh down on the markets.
Amazon stocks buying Levels are $2412, $2346, $2266, $2167, $2032 (I am only buying small). I am now 39% invested up from 28%, however I have decided to decrease my target exposure by about 25% so my current exposure jumps to 51%. And I am only going to continue to add via small buys as the stock price falls towards $2,000!
The bottom line is I have always classed Amazon as being a dubious stock, to much financial engineering going on which is why I stated that I don't trust it's EGF of 71% and is a stock that I don't entirely understand. Still the stock is prone to strong trends higher on very high multiples and does have a tendency to spike higher which means there is a good probability that Amazon will eventually trade to new all time highs Basically I don't really like Amazon, which means on a spike above $3000 I will once more seek to sell most of that which I bought, until then I continue to lightly accumulate. I have also dropped it a notch on my AI stocks table to Number 8.
Remember folks without the benefit of hindsight, buying levels are the next best thing, keeps one out or light until deep deviations materialise, else one would be like the many fools peppered on youtube who thought Amazon was a good buy at $3000 just because they announced a stock split such as this clown who dumped $60k into Amazon at near $3000 a share.
For just $4 bucks per month he would now be over $10k better off and there are countless examples of such lemmingesk behaviour following Amazon and Alphabets stock spit announcements as if it were a signal to go ALL IN on these stocks for no fundamental or even technical reason.
What's the odds this fool will soon SELL ALL at a MUCH LOWER PRICE, at $2100? I'll update if I see such a video.
GOOGLE : $2300 PE 20.8 : EGF -11% : EC 15
Google traded down to a new bear market low of $2262. The overall trend picture remains as per my last update so I see no reason to generate a new chart as Google continues to target a trend to $2000 hence more downwards price pressure from another tech giant.
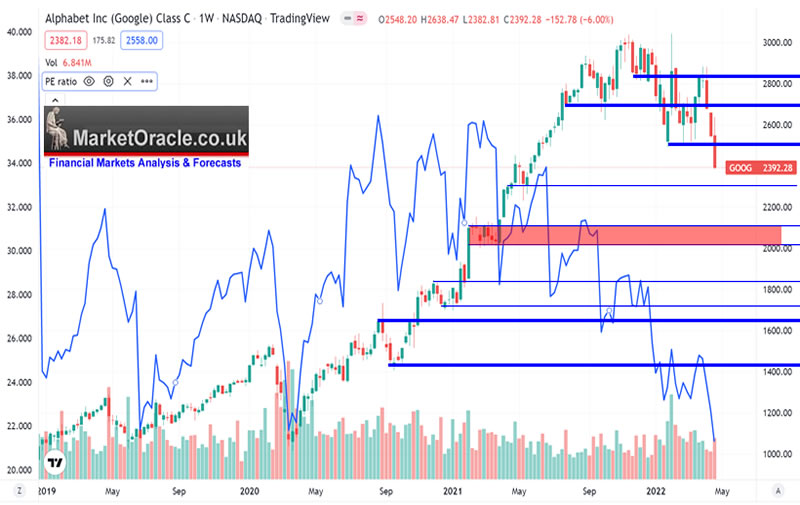
Google buying Levels remain at $2262, $2022, $1842, where my limit orders are at 2256, 2136 and 2022 as I continue to accumulate into the primary stock on my list with my current exposure at 47% invested, so I am nearing the half way mark for my target exposure, as a reminder from near 100% invested, I sold approx 1/3rd of Google Mid 2021, and another 1/3rd during December 2021, that left me a little under 30% invested that since late January I have been seeking to accumulate back into at deep deviations from the highs.
MICROSOFT $278 : PE 30.3 : EGF -3% : EC 66
Microsoft's technical picture remains unchanged from last week with the stock trading at $278 vs $274 a week ago as the price floats on thin air awaiting it's Amazon moment, thus my expectations remain for Microsoft to trade below $242, where I will only seriously contemplate buying sub $232 and that the stock price could even trade below $200 so a lot of potential downwards pressure on the general stock market indices from Microsoft.
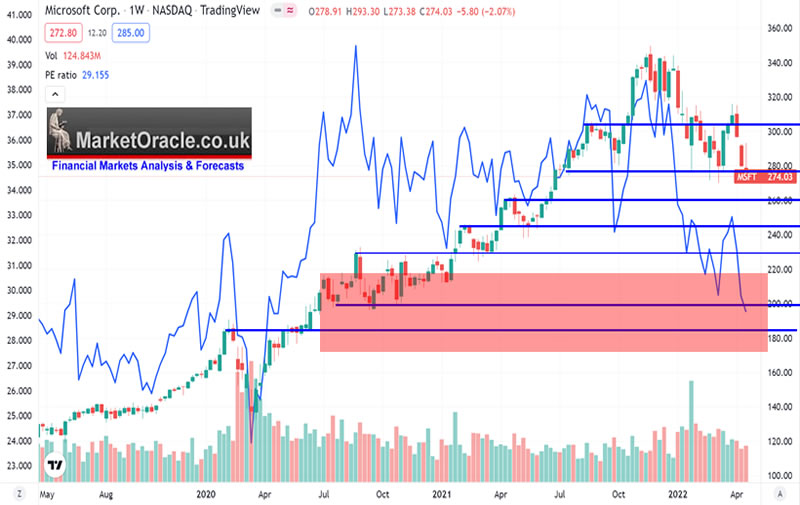
My current exposure stands at 14% down from last weeks 15% as I took the earnings bounce as an opp to reduce exposure and I am in no rush to buy as I await much lower prices that could be imminent, given that Microsoft has already bounced 4 times off bear market support, all without igniting a bull run to new highs, so it is highly probable that the low will break on the fifth assault on the lows which given Fridays price action looks imminent,
APPLE $157.6 : PE 25.6 : EGF -1% : EC 29
And finally APPLE the stock markets ticking time bomb that so far has REFUSED TO DROP and given that Apple is 7% of the S&P what next happens to Apple is critical to the S&P's next big move where my consistent view to date has been that Apple is targeting a trend to BELOW $142 and that I would not be surprised to see Apple trade as low as $120, as a move to X20 earnings would result in the stock price falling $123.
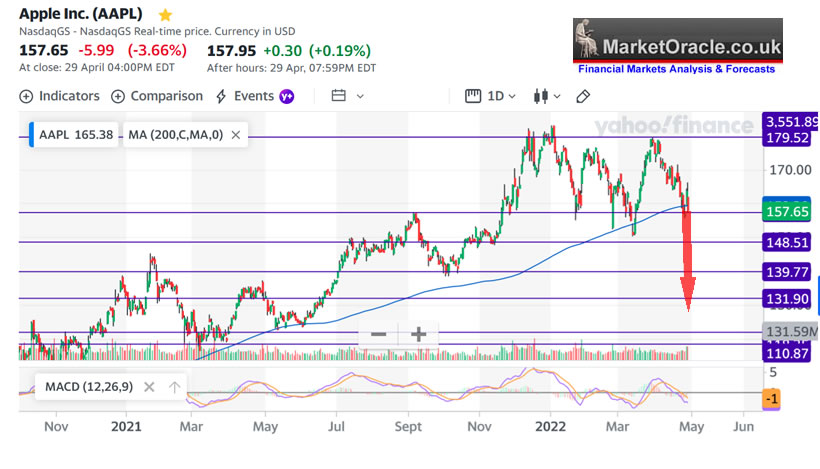
Buying levels remain at $148, $140, $132, $124, $120, Where I seek sub $132 for any significant buying.
DIRT CHEAP
QCOM - $140 - Strong earnings report resulted in one of the few stocks with still a positive EGF at 18%, trading on a PE of 14 which still makes this a dirt cheap stock where now $131 appears to be the floor, thus I will be seeking to accumulate at under $133 on my current exposure of 88%..
CHEAP
AMAT - 110 - PE 15 - EGF 3% - I am now 95% invested. So my buying is light. My current limit orders are at $106, and $92.
INTEL - $43.6 - PE 8.8 - EGF -30% Disappointing earnings sent the stock a little lower. There isn't much downside for this stock i.e. $42 is support that dates back 5 years. I am 108% invested so no plans to buy any more.
FB - $202 - PE 15.1 - EGF -18%. - There is a limit to how cheap a cheap stock can get before it rockets higher, and that was the case with Facebook that soared from a low of $169 to an early Friday high of $212. I am 134% invested with no plans to buy more. Buying level would be $190 as I doubt Facebook will revisit the likes of $169 any time soon, instead the most probable direction of travel is higher towards $300.
AMD - $85.5 - PE 31, EGF 31% - Bounced off support at $83, currently trades on a PE of 31 appears high but with an EGF of 31% should drop fast with earnings on the 3rd of May that I suspect will surprise to the upside. Nevertheless downside appears very limited and thus I will definitely increase my exposure on any pre and post earnings drop, unless the earnings report is disastrous. The buy zone for AMD is between $86 and $76. Where I have limit orders at $81.1, $76.5 and $73.2 to hoover up further exposure on any general market panic slump.
THE VALUTION RESET 9 MONTHS ON
For most other stocks trading above a PE of 18 then watch out below as I warned to expect over 9 months ago AI Stocks Portfolio Buying and Selling Levels, Bubble Valuations 2000 vs 2021
Amazon to the MOON 2021! Then what?
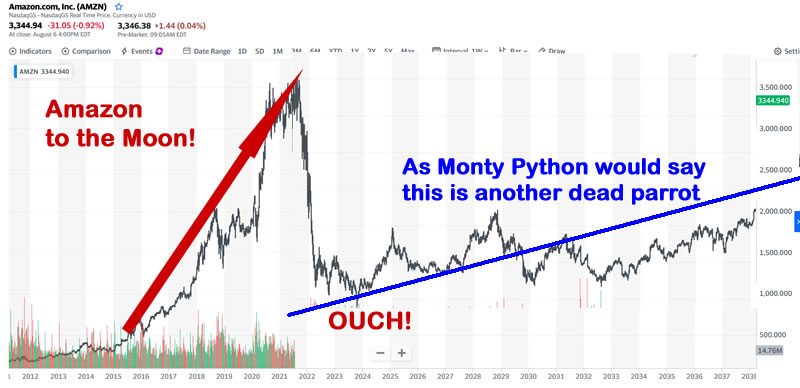
Yes, at this point in time not even I can get my head around Amazon actually trading down to $1000 dollars a share, even though I understand that it is possible, and thus why I mentally am only able to see as low as $2000 being the most probable outcome even though my analysis warns of the potential for far worse to come for this over priced, over hyped tech giant that could soon become a dead parrot, festering away in ones portfolio for a decade below that which one bought. That is the risk of the worst case scenario posed by the valuation reset and hence why I am a very reluctant buyer of Amazon, Apple, Microsoft and Nvidia, all of the tech giants that continue trade on multiples well north of 18, whilst I have a sweet spot for AMD which I may come to regret at a later date, only time will tell.
For more buying levels see my earlier article The Stocks Stealth BEAR Market, AI Stocks Buying Levels Going Into Earnings
Will Apple Crash the Stock Market?
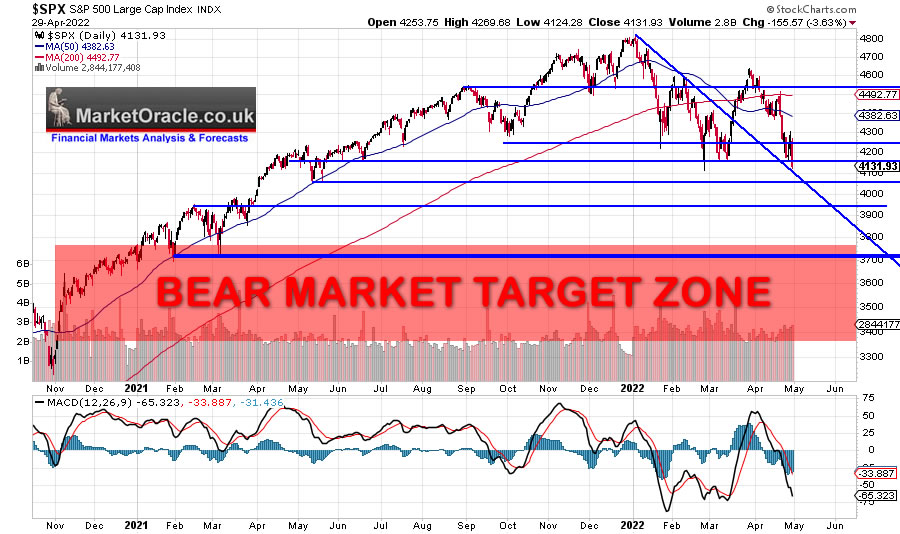
The S&P is perched just above support at 4100. Whilst a quick technical take would suggest that the S&P should bounce off support for a potential double bottom and thus set the scene for a strong rally during May, after all the S&P has already bounced from this level 4 times before. However, the prerequisite for the bullish scenario for a strong rally into Mid May was off of a significantly higher low at around 4280, So whilst the S&P falling to near 4100 may seem like a great spring board for generating an even better buying opportunity ahead of the MAY bounce, but the fact that the S&P had not already bottomed say a week ago at a much higher price WEAKENSS TECHNICAL PICTURE, the pattern for a strong MAY BOUNCE off of HIGHER LOW no longer exists. The bullish pattern now would be for a bounce off the previous significant support of 4100 that targets a LOWER HIGH i.e. under 4600.
But now given the weaker technical picture there is a heightened risk of the S&P BREAKING to the downside which would result in a swift waterfall event of a rapid decent to new bear market low at well under 4100.
When I look at the major tech stock components of the S&P such as Google (3.8%)(, Amazon (3.7%), Nvidia (1.4%), Tesla (2%) all of which have WEAK stock price charts that are going to bear down on the index to some degree. And then we have Apple and Microsoft over valued nuts that look primed to crack that represent 7% and 6% of the S&P! So if as is probable either of these nuts crack and head say 20% lower then that directly translates into a 100 point plus drop in the S&P which will act to pull most stocks lower with them that could easily see the S&P trade down by several hundred points over a few days time in a market panic waterfall event.
So in summary
- The S&P is trading near it's bear market low.
- Many major stocks that comprise the S&P are already WEAK and indicating they are headed lower.
- APPLE and or Microsoft could be on the verge of experiencing their Amazon, Google, Nvidia, AMD, TSMC moment and if these nuts crack at any point over the next few days then it;s bye bye to S&P support at 4100 and we enter Bear Market Phase 2, a few months ahead of schedule.
How low could the S&P blow?
Remember folks my preliminary target for this bear market is to trade down to between Dow $29k to $31k (pending next in-depth analysis) and applying mu earlier calc's of the Dow directly to the S&P then the S&P bear market target low is between -21.5% and -28.5% off it's 4818 high which resolves to a range of 3789 and 3446, with significant chart support at around $3,700 suggesting a probable level that the S&P to target, which would represent a -23.2% off the bull market high where my original expectations were for this to be attained sometime during the summer from Mid July into the end of August.
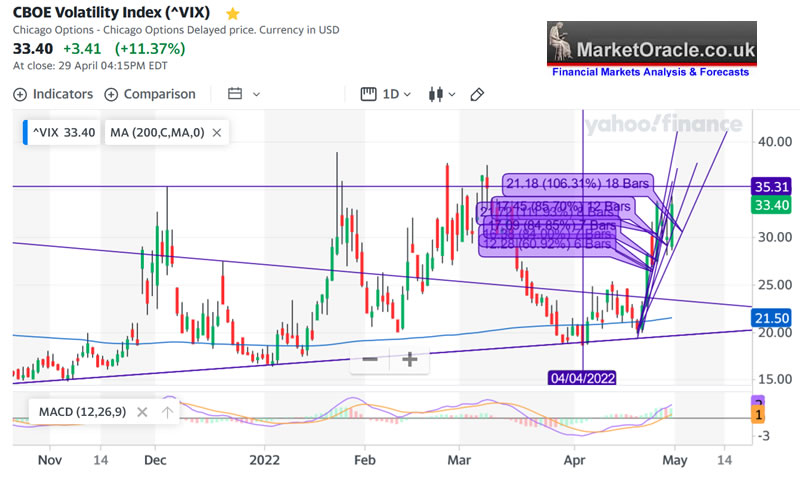
As for the time line for such a trend then the VIX is suggesting that if a an imminent panic event materialises then it is going to be short lived i.e to conclude between the 3rd of May and 13th of May with the cluster of probabilities suggesting an end nearer to the 3rd of May then then 13th of May.
as I iterated once more last week, which is the primary direction of travel i.e. in a bear market stocks resolve to the downside regardless of expectations for a corrective rally, that's always the risk and hence why one needs to wait for those deep discounting events and even then scale in over a period of time, because as I warned way back in January when the dust finally settles stocks could go much lower than any one can imagine they could ahead of time.
I have often stated that I think this bear market is only at the half way mark, and Apple cracking support at $4100 could trigger the SECOND half of the bear market. Originally I envisaged this happening during late Summer, so as to allow me time to spend a couple of weeks doing in depth analysis during May so I can map put a trend forecast into the end of the year , but the market follows it's own schedule
The fact that so many of the tech giants have busted through their support levels, is NOT GOOD NEWS! YES it's great to get buying opportunities, in Google, Intel, Amazon etc, BUT ALL IN ONE GO has damaged the stock market. where the stock markets fate literally rests with one stock - APPLE. for which I see a breakdown as inevitable , APPLE WILL TRADE BELOW $140 THIS YEAR, and if it happens NOW that's NEW LOWS for the S&P.
CI18 Crash ./ Bear Trigger
Firstly we are already in a bear market. so whilst the CI18 calc's to 96% today it's not saying anything new in terms of the bear market, instead at best it is suggesting that a waterfall event is no likely, rather to expect a more orderly decline over a number of days rather than an actual crash event.
US Real GDP -1.4%
And briefly the US posting -1.4% REAL GDP for Q1 does not bode well for average corporate earnings and thus average stock prices, which means one needs to continue to ensure one does not OVER PAY for stocks and PAY ATTENTION to valuations.
So what am I doing?
I will continue to accumulate target stocks that trade to DEEP discounts from their highs, remember I am not buying stocks at -14% where the S&P currently stands, but in many most cases x2 to x3 that decline, as I await further drops of 20% for Apple and Microsoft to accumulate into. Remember stocks do not all bottom at the SAME TIME!
Today's market ahead of a potential significant decline comprises cheap stocks such as Qualcom and Facebook and expensive stocks such as Apple and Microsoft with a whole spectrum in between that range from AMD and TSMC at the lower end all the way upto Amazon, Broadcom and Nvidia at the higher end for which I see greater price falls ahead than for the likes of Qualcom and Facebook. And we may even see some stocks buck the trend and go higher! Hence why I don't tend to pay that much attention to the indices but instead focus on individual stocks as the stocks bear market tasmanian devil cycles through the stocks one by one.
In terms of planned buying the only change I have made is to move the big buys further away i.e. Google big buy is now at $2056, and Amazon $2112, with fewer small buys above.
So batten down the hatches for probable Bear Market Phase 2 to become manifest some 3 months ahead of my original expectation that has prompted me to lower my big buys, focus on small buys and increase short positions.
The bottom line is that we are in bear market as of the 5th Dec CI18 bear warning that has a lot further to run in terms of price and time.
Cathy Wood is INSANE!
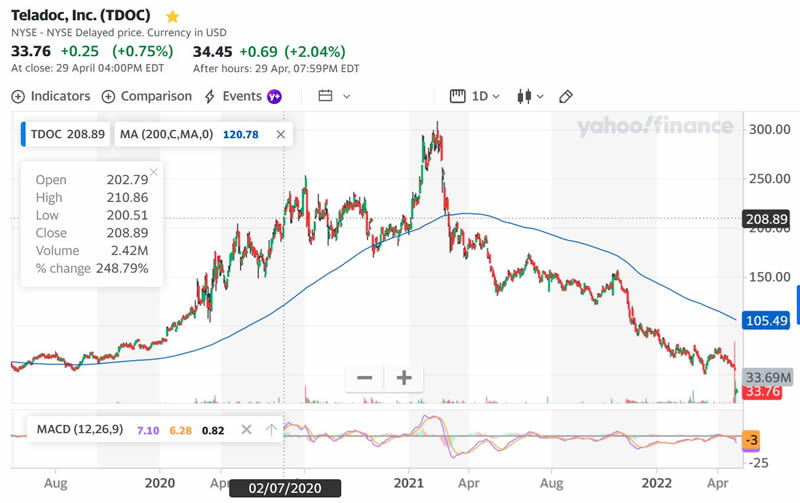
One of ARKKS biggest position Teladoc collapsed 37% on BAD earnings, taking the stock down by 90% from it's high. What does Cathy Wood do? She goes and buys another 22 million shares! And then shows her face on MSM to try and pump the stock higher by explaining why Teladoc is a great buy and why she just threw another $800 million at this piece of no earnings garbage.
If she actually knew what she was doing she would be investing in the likes of Qualcom, the fact that one of her biggest holdings was already down by over 80% and then collapsed by another 37% and all she can do is regurgitate the same crap as she has been doing for over a year and then goes throws another $800 million of investors money at no earnings trash illustrates to me that she is an INSANE GAMBLER!
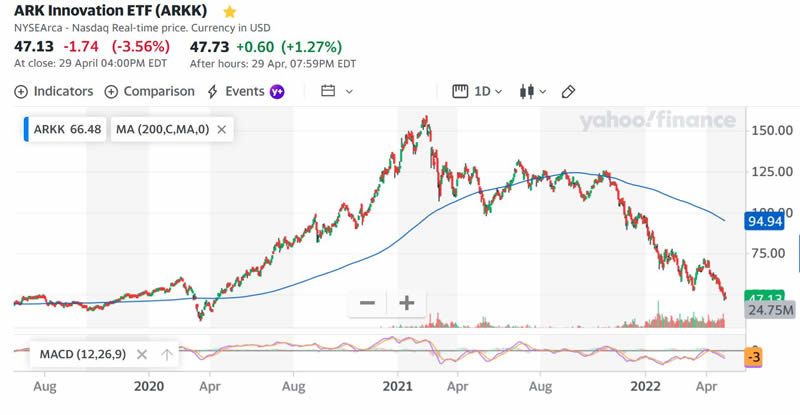
This isn't a bear market, this is 1930's depression, so much for the disruptive mantra! And to think the S&P is only down about 14% vs ARKK's near 72% collapse with likely at least another 50% drop to come! as I have been warning to expect since February 2021!
ARKK Garbage
A warning to all the hodlers of such growth tech stocks and funds such as Cathy Woods's ARKK, the price drops may not even be half way done!
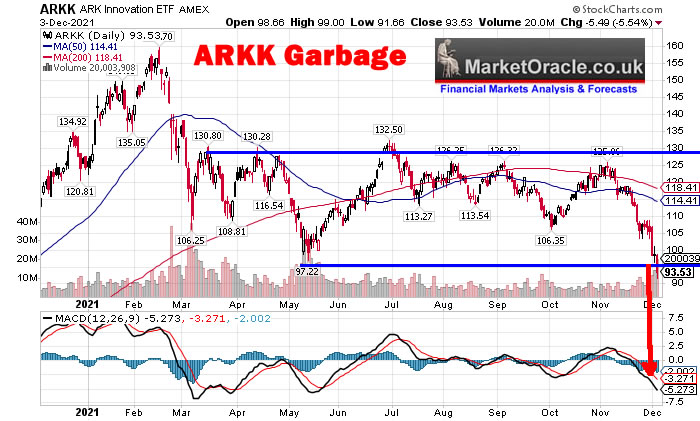
What happens to ARKK when her largest holding Tesla cracks? People have invested their life savings in the ARKK insane asylum! Don't they have an exposure limit or is it a case of keep throwing good money after bad until they run out of new inflows? Classic Noob investing mistake! THERE IS NO EXPOSURE LIMIT because the stocks keep FALLING in VALUE! Instead if she had been focused on ACTUAL CASH INVESTED her fund would be down LESS than HALF what it is! Cathy Wood does not have a CLUE of how to actually invest! ARKK is down 48% year to date and near 72% off it's high.
However in terms of market sentiment this will be destroying the confidence of many retail investors for they will be thinking what hope do they have if someone they looked up to is having her funds value DESTROYED, and thus panic selling sets in which will mean the bottom in price is not that far off.
Putin May Soon Decide to Put the World on the Path to Nuclear World War 3
Watching the Ukraine war unfold which continues to follow my expected direction of travel all the way towards the use of tactical nuclear weapons that the clueless MSM had dismissed until recently, however which I saw as inevitable since January. However, escalation on top of escalation has me pondering what comes next AFTER the use of tactical nukes which Putin WILL use. The western response to tactical nukes will be severe and will see a further escalation in the deployment of heavy military equipment to Ukraine with threats against Russia. At which point the next step an ageing and increasingly mentally stressed Putin will probable take is the decision to go down the path of a nuclear world war 3 and thus keep escalating the conflict, perhaps have it spill over into neighbouring states where he will have decided to go all the way right upto the point he presses the nuclear button rather than lose the war.
Thus the West is badly miscalculating Putin and where this is going for the consensus view is that nuclear war will NOT happen, Putin will NOT use nuclear weapons, even today, the use of tactical nukes in Ukraine is a grey area in that he might but will probably not given the Western response. The so called intelligence agencies and western commentariat have failed to understand right form the outset that Putin has NO choice but to decidedly WIN the war else he will BE KILLED! For what the Russian high command cannot stomach is a weak leader, they would rather be ruled by a brutal psychopath then some one who is weak.
Thus expect the War in Ukraine to continue escalating, in which respect I would not be surprised if Putin orders conscription so as to bear down overwhelming force onto Ukraine, and unless the Russian victory is swift then the war will spill over into neighbouring states all of which is firmly leading us down the path of Nuclear War unless Putin is no longer in control either assassinated or removed form office.
See this is how a nuclear world war will happen, not by an accidental press of a button but through a sequence of events where few can connect the dots until it is too late and the nukes start flying.
Even after reading this I am sure most will be dismissing the risk of world war 3 in that "It is not going to happen". I am telling you that THAT THIS IS THE PATH WE ARE ON! PUTIN WILL DECIDE TO TAKE THE WORLD ON A PATH TOWARDS A NUCLEAR WORLD WAR 3, which will probably be shortly after the use of tactical nukes in Ukraine and in reaction to Western Response, this is the trend trajectory the world is on.
Next analysis - US Housing market trend forecast, that carries a higher probability of accuracy following release of US REAL GDP of -1.4% for Q1.
Again for immediate access to high probability trend forecasts then do consider becoming a Patron by supporting my work for just $4 per month. https://www.patreon.com/Nadeem_Walayat.
Latest analysis include -
My Main Analysis Schedule
- UK House Prices Trend Forecast 2022 to 2025 - Complete
- US House Prices Trend Forecast - 80%
- Global Housing / Investing Markets - 60%
- US Dollar / British Pound Trend Forecasts - 0%
- Stock Market Trend forecast into End 2022 - 0%
- High Risk Stocks Update - Health / Biotech Focus - 0%
- How to Get Rich - 85%

- Gold and Silver Analysis - 0%
- State of the Crypto Markets
Your analyst who will probably take a punt on ARKK's corpse when it is trading at under $20 per share ($47).
By Nadeem Walayat
Copyright © 2005-2022 Marketoracle.co.uk (Market Oracle Ltd). All rights reserved.
Nadeem Walayat has over 30 years experience of trading derivatives, portfolio management and analysing the financial markets, including one of few who both anticipated and Beat the 1987 Crash. Nadeem's forward looking analysis focuses on UK inflation, economy, interest rates and housing market. He is the author of five ebook's in the The Inflation Mega-Trend and Stocks Stealth Bull Market series that can be downloaded for Free.
 Nadeem is the Editor of The Market Oracle, a FREE Daily Financial Markets Analysis & Forecasting online publication that presents in-depth analysis from over 1000 experienced analysts on a range of views of the probable direction of the financial markets, thus enabling our readers to arrive at an informed opinion on future market direction. http://www.marketoracle.co.uk
Disclaimer: The above is a matter of opinion provided for general information purposes only and is not intended as investment advice. Information and analysis above are derived from sources and utilising methods believed to be reliable, but we cannot accept responsibility for any trading losses you may incur as a result of this analysis. Individuals should consult with their personal financial advisors before engaging in any trading activities.
Nadeem Walayat Archive |
© 2005-2022 http://www.MarketOracle.co.uk - The Market Oracle is a FREE Daily Financial Markets Analysis & Forecasting online publication.


