


Ah, Snap! Here's What Snap Inc.'s Stock Price Action is Likely Signaling
Companies / Social Media Jul 12, 2022 - 07:07 PM GMTBy: EWI

"Air-pocket declines ... are harbingers"
Snap Inc. is the company which developed Snapchat, the social media app which allows users to customize the content they share with others -- right in the app.
Recently, the firm introduced Snapchat+ -- available for $3.99 a month.
Snap could use some success -- it's been a tough go lately.
The June Global Market Perspective, a monthly Elliott Wave International publication which covers 50-plus worldwide financial markets, showed this chart and said:
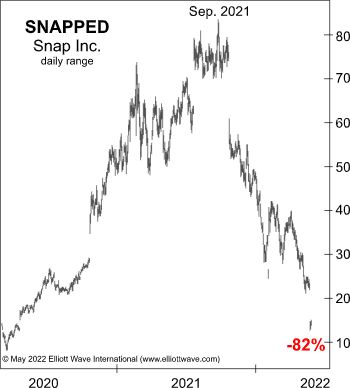
Technology routs are becoming more contagious. On [May 24], when Snap Inc. announced that it will slow hiring as it braces "to miss earnings and revenue targets," its shares declined more than 44%, and other social media giants quickly followed. ... The air-pocket declines in various indexes and stocks matter, a lot. They are harbingers.
On May 27, the day the June Global Market Perspective published, Snap's stock price was trading at $15.58.
As of this intraday writing on July 6, the price is even lower -- $14.18.
Despite the big price drops in well-known technology names, you might be surprised to learn that many professional market observers are still bullish.
Indeed, here's a June 22 Yahoo! Finance headline:
Analysts remain 'unusually bullish' about S&P 500 stocks despite downturn
In Elliott Wave International's view, the combination of the downtrend in U.S. stocks with a highly bullish sentiment is nothing less than a major warning sign.
But what about stocks in other parts of the world?
The Global Market Perspective has you covered, whether you are interested in the U.S., Asia-Pacific, Europe or other parts of the globe.
For example, our just-published July Global Market Perspective says:
The FTSE's long-term waves have ... frustrated the bulls and bears alike. At its June 17 intraday low of 6998, Britain's benchmark index stood just 47 points above its intraday peak on December 30, 1999. In other words, an entire generation of investors underwent an agonizing 22 years of ups and downs and now has less than a single percentage point of capital gains to show for it.
That comment is accompanied by a chart which shows the Elliott wave structure of the FTSE, and hence, what you can expect next.
If you want the details of how the Elliott wave model can help you analyze financial markets, here's a suggestion: Read Frost & Prechter's book, Elliott Wave Principle: Key to Market Behavior.
Here's a quote from this Wall Street classic:
All waves may be categorized by relative size, or degree. The degree of a wave is determined by its size and position relative to component, adjacent and encompassing waves. [R.N.] Elliott named nine degrees of waves, from the smallest discernible on an hourly chart to the largest wave he could assume existed from the data then available. He chose the following terms for these degrees, from largest to smallest: Grand Supercycle, Supercycle, Cycle, Primary, Intermediate, Minor, Minute, Minuette, Subminuette. Cycle waves subdivide into Primary waves that subdivide into Intermediate waves that in turn subdivide into Minor waves, and so on. The specific terminology is not critical to the identification of degrees, although out of habit, today's practitioners have become comfortable with Elliott's nomenclature.
If you'd like to learn more, know that the entire online version of the book is available to you free once you join Club EWI -- the world's largest Elliott wave educational community.
A Club EWI membership is free, and members enjoy free access to a wealth of Elliott wave resources on investing and trading without any obligations.
You can have the book on your screen in moments as you follow this link: Elliott Wave Principle: Key to Market Behavior -- instant and free access.
This article was syndicated by Elliott Wave International and was originally published under the headline Ah, Snap! Here's What Snap Inc.'s Action is Likely Signaling. EWI is the world's largest market forecasting firm. Its staff of full-time analysts led by Chartered Market Technician Robert Prechter provides 24-hour-a-day market analysis to institutional and private investors around the world.
© 2005-2022 http://www.MarketOracle.co.uk - The Market Oracle is a FREE Daily Financial Markets Analysis & Forecasting online publication.