Wild Crude Oil Markets Long-term Trend
Commodities / Crude Oil Oct 29, 2008 - 08:21 AM GMT Sean Brodrick writes: When people ask me if I think crude oil is going to $50 or $150, I nod sagely and say: “Yes, probably.”
I'm not being flip. I'm simply giving both the short-term and the long-term timeframes.
Short-term, crude oil is probably heading lower, even though it's nearly 60% off its highs.
The last chance to hold the line on oil prices was at OPEC's emergency meeting. And the oil cartel choked like a cat on a hairball. They cut 1.5 million barrels per day of production when they needed to cut about 3 million barrels per day.
The OPEC meeting was the last obstacle in the way of deflationary forces that are driving oil prices lower in the short-term. Long-term, there are forces that should drive oil much higher. And one of the paradoxical things about the oil market is the longer that prices stay lower, the harder, faster and more furious the rebound will probably be.
 |
| OPEC members choked like a cat on a hairball at their recent emergency meeting. |
The good news is you can make money on both sides of the market.
We'll get to the long-term forces in a minute, as well as potential trading opportunities. First, let's look at the short-term forces.
Short-term Force #1: Economic Weakness
The prices of commodities and stocks are down across the board as investors resign themselves to some form of global recession. Economies from Boston to Beijing are grinding into low gear. And demand for crude oil and gasoline is falling off a cliff.
Here in the U.S., Americans are using around 18.6 million barrels of oil a day, a drop of 1.8 million barrels year over year. Demand for gasoline is decelerating rapidly.
 |
Take a look at this chart from Calculated Risk and you'll see what I mean.
Americans drove 15 billion fewer miles this past August compared with the same month a year ago — a drop of 5.2% and the biggest single monthly decline since 1942, the first year data was collected.
Short-term Force #2: Hedge-Fund Selling
Hedge funds were responsible for much more of oil's climb to $150 than I or a lot of other analysts thought possible. Now, hedge funds are being hit by heavy redemptions as investors cash out and run for cover. One report concludes that investors pulled $210 billion out of U.S. hedge funds during the third quarter, forcing the funds to dump assets, including oil, thereby driving down prices.
The good news is that hedge funds can't sell forever. And in fact, the worst of it should be over by the end of this year as investors square their books and take their lumps.
Short-term Force #3:
The Rising U.S. Dollar
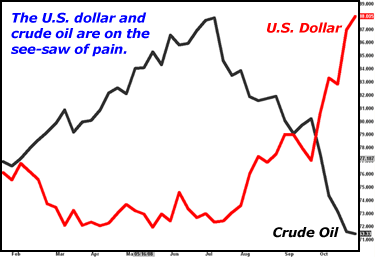
As investors flee for safety, they sell risky assets and go into U.S. dollars. This has pumped up the dollar's value. And since oil is priced in dollars, a higher greenback tends to push crude oil prices lower.
With the economy on the skids, why is the U.S. dollar looking like a safe haven?
 |
The reason is that Europe has been hit by the credit crisis even harder than the U.S. And Eurozone countries are responding to the crisis separately — not working as a group.
This undermines confidence in the euro, and makes the U.S. dollar shine by comparison. Also, many foreign banks need dollar financing. That's all the worse for them, because they can't get loans from U.S. banks as the credit crunch worsens.
Looking at this chart, you can see that crude oil and the U.S. dollar are mirror images of each other now.
But the U.S. dollar is due for a pullback in its rocket ride. That said, crude could easily go to $50 a barrel before its correction is over — becoming as deeply oversold on the downside as it was overbought on the upside.
Now, Let's Look At Some Long-Term Forces That Could Push Oil Much Higher
Long-term Force #1: Mexican Production Is Falling Off a Cliff
Yes, this has been going on for a long time. But it's getting worse, despite the Mexican government's frantic efforts to reverse the trend.
 |
| Mexico is using more of its own oil and cutting exports to the U.S. |
For the month of September, Petroleos Mexicanos (Pemex), the state-owned oil company, said monthly crude output fell to the lowest since November 1995.
Production fell to 2.7 million barrels a day in September, a decline of 14% from a year ago. What matters to us, though, are exports — Mexico is the #3 supplier of imported oil to the U.S. And since Mexico uses more and more of its own oil, exports to the U.S. fell to 845,000 barrels a day, the lowest since October 1995.
And it's not just Mexico — production is also falling in Russia, Kazakhstan and other oil exporters.
Long-term Force #2: Production in the U.S. Gulf of Mexico Is Trending Lower
Hurricane season is nearly over, but we're still feeling the impacts of Hurricanes Gustav and Ike. The Minerals Management Service recently said approximately 38.6% of the production in the Gulf was still shut-in, for a total of 32 million barrels of crude oil and 165 billion cubic feet of natural gas production in the month of September.
We can expect more drops in Gulf of Mexico production in the future in the wake of future hurricanes, because hurricanes are becoming both more frequent and more powerful.
Since 1995, there have been 207 named storms in the Atlantic basin, which includes the Gulf of Mexico — a 68% increase from the previous 13 years, according to statistics from the National Oceanic and Atmospheric Administration. Of those storms, 111 were hurricanes, a 75% increase over the previous period.
Long-term Force #3: Investment in New Oil Wells Is Threatened by Lower Prices
The good news is that oil services companies, including Halliburton and Schlumberger, are reporting no slowdown in demand for their services. But if oil prices stay low for too long, it's likely that the oil majors will reconsider developing costly projects.
Close to a dozen companies have already announced cuts to 2009 budgets. For example, Brazil's Petrobras is pushing back development of some of its new underwater oil fields by years.
The longer oil prices stay low, the more expensive new projects will be delayed. And when the recession ends and fuel demand increases again, those new projects won't be there to meet new demand. And that supply/demand crunch could light a fire under oil prices.
Long-term Force #4: We're Only Seeing a Pause In the Commodity Supercycle
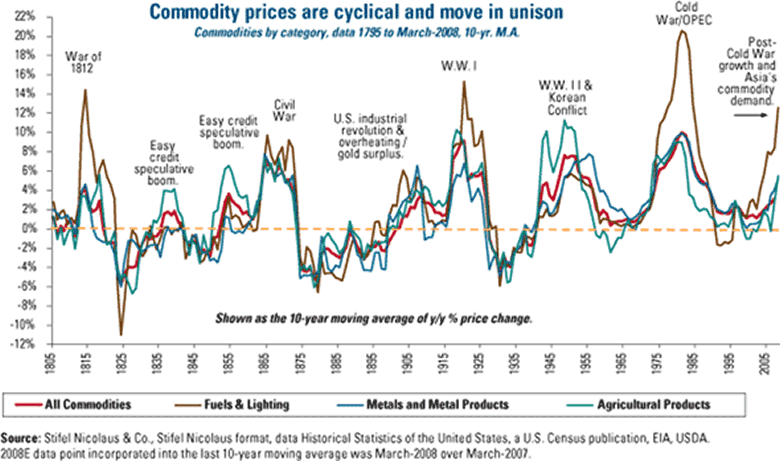
Research by Morgan Stanley indicates that commodity markets tend to move together …

This chart shows the cyclical trends in commodities prices. The upswings, or commodities supercycles, can last 20 to 25 years, according to Morgan Stanley's research. And if the current one follows the pattern, we have many years to go before it plays out. The key drivers are the rapid economic growth in China and infrastructure spending in other large emerging markets.
The fact is, commodity bull markets can see corrections that will make your head spin.
Other commodity bull markets in modern history — roughly spanning 1906 to 1923, 1933 to 1955 and 1968 to 1982 — lasted more than twice as long as the current run. They included some sharp corrections before they ran their course, suggesting that the current drop, however sharp, could be temporary.
Short-Term Blues, Long-Term Bulls …
Yes, deflationary forces are at work. And they are growing in momentum. The good news is that, considering the potential magnitude of the declines ahead, the downdraft in commodities should be over and done quickly — as short as it is dramatic. And the end of deflation will clear the way for the subsequent bull market.
So if you made money in the prior phase of the bull market in resources and emerging markets, wait till you see the kind of money you can make in the next phase, with massive opportunities in gold, silver, oil, other natural resources, and emerging markets.
2 Ways to Play This Wild Market …
If you want to play the potential downdraft in crude oil — a move that could take it to $55 or even $50 a barrel, here's how to do it …
The PowerShares DB Crude Oil Double Short ETN, symbol DTO, is an exchange-traded note (ETN) that gives investors twice the inverse performance of the DB benchmark crude oil index, plus the monthly T-Bill index return.
However, the DTO is not heavily traded, so there is a gap between bid and ask that is larger than I'd like. So you might consider the UltraShort Oil & Gas ProShares ETF, symbol DUG. It is very liquid and targets twice the inverse of a big basket of energy sector stocks.
And when oil bottoms and starts to head higher …
You could consider the PowerShares DB Crude Oil Double Long, symbol DXO. This exchange-traded note backed by Deutsche bank gives investors exposure to twice the monthly performance of the DB optimum yield crude oil index, plus the monthly T-Bill index return.
DXO is more liquid than the DTO — the DXO recently traded about a million shares a day.
But for real liquidity, consider the Ultra Oil & Gas ProShares (DIG). It recently traded 20 million shares per day. And it's a mirror image to DUG — DIG targets twice the performance of a basket of energy stocks including Apache Corp., Chevron, Devon Energy and more.
These are incredibly volatile times in the commodity markets, and crude oil is no exception. But this painful pullback will lead to some amazing opportunities, and clear the way for the next leg up.
Yours for trading profits,
Sean
This investment news is brought to you by Money and Markets . Money and Markets is a free daily investment newsletter from Martin D. Weiss and Weiss Research analysts offering the latest investing news and financial insights for the stock market, including tips and advice on investing in gold, energy and oil. Dr. Weiss is a leader in the fields of investing, interest rates, financial safety and economic forecasting. To view archives or subscribe, visit http://www.moneyandmarkets.com .
Money and Markets Archive |
© 2005-2022 http://www.MarketOracle.co.uk - The Market Oracle is a FREE Daily Financial Markets Analysis & Forecasting online publication.


