


Stock Market Trend Target, Why Peak Inflation is a Red Herring
Stock-Markets / Stock Market 2022 Aug 20, 2022 - 03:29 PM GMTBy: Nadeem_Walayat

The stock market remains within a trading range of S&P 3935 to 3720 with the most recent price action being a rally following a brief break BELOW the range on Thursday to run the long stops before the market reversed sharply higher. The S&P looks set to target a break of 3935 the importance of which would be to go against the bear markets tendency for down swings to exceed the preceding up swings which thus acts to weaken the bear market until either a reversal from bear market to bull market is confirmed or the bear market once more puts in a dominant big downswing. Nevertheless a break above 3935 would indicate that the last swing down was just -5.7% and thus corrective against the previous upswing of +8.9% that at least suggests to expect a similar swing higher and thus in the first instance targets 4036 which is inline with my existing target to reach resistance between 4080 and 4120.
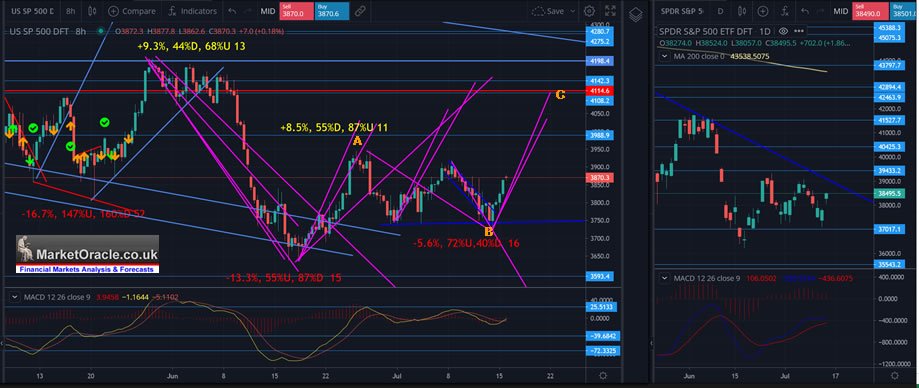
So what happens next if the stock market breaks above 3935 (as expected) and rallies to target of 4080 with perhaps overshoot to 4100, will that mean that the bear market is probably over and we at least have seen the lows? We'll the above chart implies an ABC pattern which is corrective and thus probability would favour a resumption of the bear trend to target new lows once more and thus remains inline with my big picture trend target.
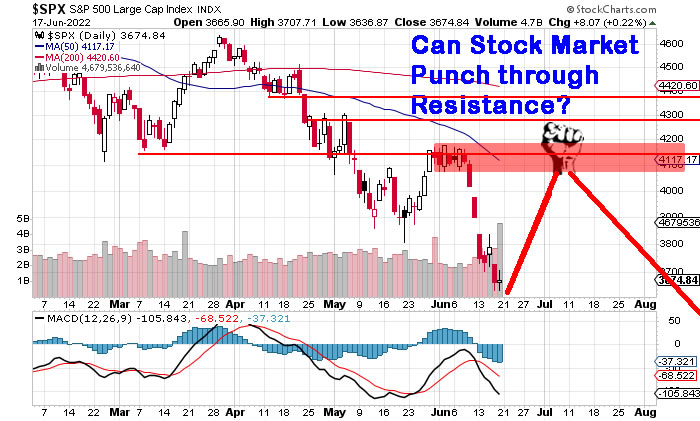
So in summary the market is currently in the middle of it's short-term trading range, positioned equally for either a move higher or lower in response to earnings reports where my expectations are for a break HIGHER to fulfill my target of S&P 4080, above which lies heavy resistance which will be tough to punch through and so likely will FAIL to do so and thus I expect the bear trend to resume. Though note the market has repeatedly demonstrated the tendency to run stops as we saw late last week when long stops were run through before the market reversed higher. So the same could happen to the upside i.e. the market could rally as high as 4180 to run the short stops and THEN reverse lower, the charts are littered with such price behaviour..
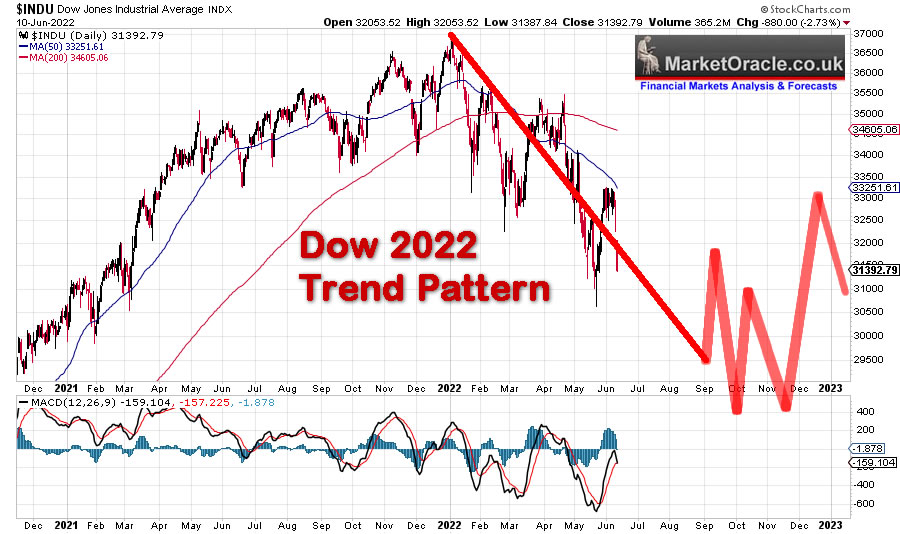
Also note if by some miracle we actually have seen THE bottom then the market won't look back, i.e. there won't be a second chance to buy any of the target stocks near their recent lows, but I see this as a low probability at this point in time, thus my expectations remain for this rally to ultimately resolve in at least a test of the bear market lows and probably will make a new bear low to around my Dow target of approx 29,600 / S&P 3600.
So IF the market does break higher (high probability) then it will most likely be a bear trap. Whilst if the market instead breaks below the bottom of the range at 3720 then it's going straight to a new bear market low to below 3620 (low probability).
WHY PEAK INFLATION RED HERRING
When one looks under CPI inflation hood then one sees strong signs of inflation topping, given what we have already seen transpire in the commodities markets such as Gasoline prices having fallen since the May inflation report and many of the components such as Airfares also turning lower.
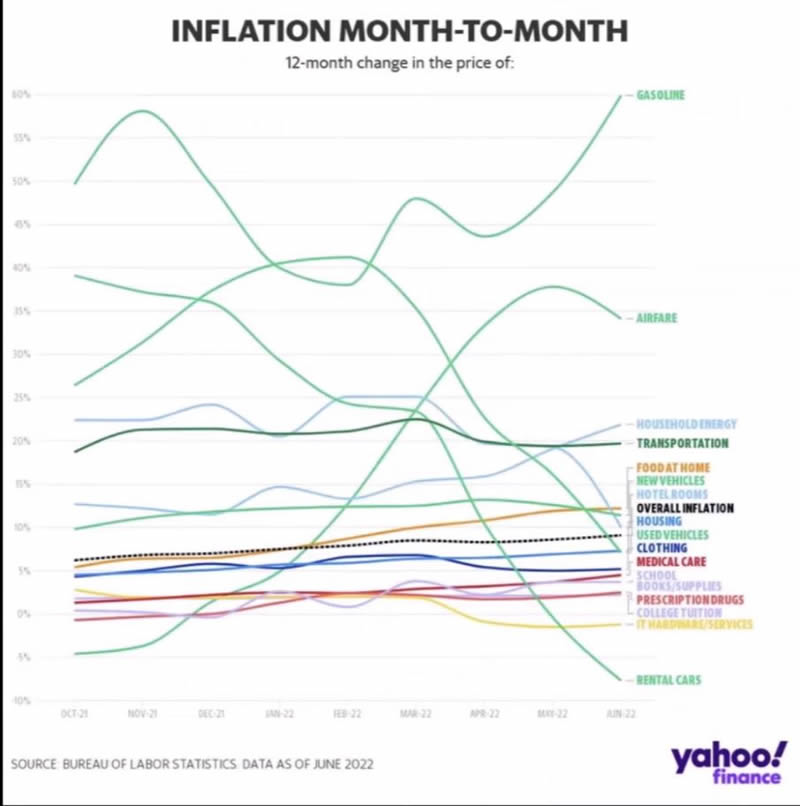
So obviously this is being taken as good news, inflation has peaked so the Fed can take the foot off the brake, and I am sure will soon be accompanied by murmurs for the possible early return of QE. After all I can imagine many are thinking yes inflation is running hot at over 9% but it's not that bad, so maybe the 1970's were not as bad as people tend to make out to be?
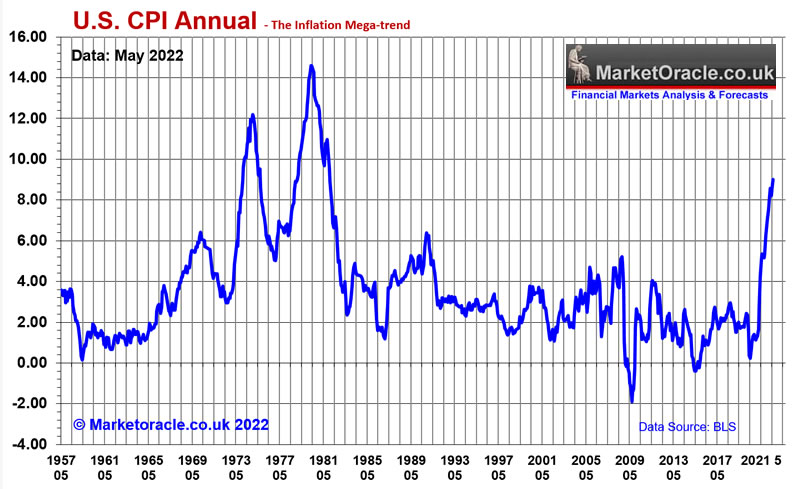
Unfortunately the annual changed in the rate of inflation that virtually all focus on is a red herring and fails to represent the true damage done by inflation during the 1970's that the US and most of the rest of the West looks set to replicate during the 2020's for the fundamental fact that the PEAK Inflation that everyone is seeking and likely to get as early as next month is irrelevant! It's what happens in the run up to the peaks and in their aftermath that does all of the damage.This is why virtually ALL of the pundits and so called economists fail to understand that the PEAK INFLATION they are all focusing on is not the END of Inflation but marks the BEGINNING of the inflation PAIN that will persist for the whole of this decade.
So understand this all the pain folks have experienced to date is NOTHING compared to that which is to come where my following chart of the 10 YEAR inflation rate gives a clearer picture of what happened during the 1970's and what has a high probability of repeating during the 2020's.
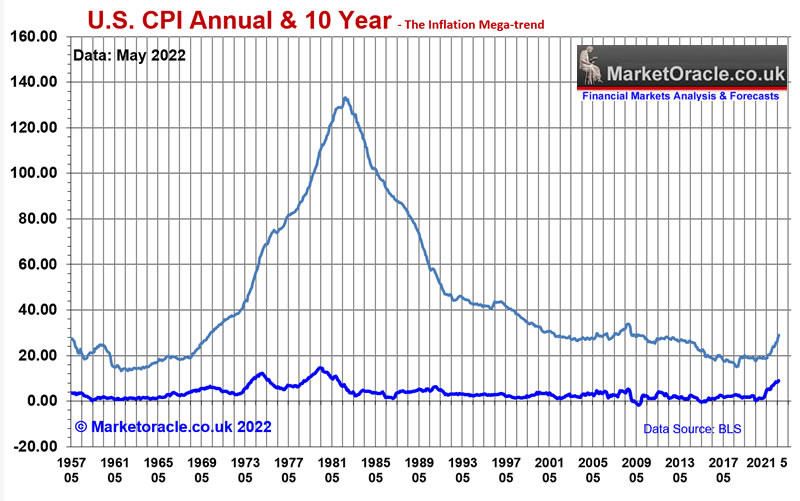
Those 12 month PEAKs are largely irrelevant! The US, UK and the rest are going to experience WAVES of inflation which whilst they won't exactly replicate the 1970's in terms of magnitude i.e. US inflation is peaking at 9% rather than say 12%, or 14%, but the issue is that everyone assumes that Inflation peaking is the end of the inflation story. NO, far from it, because as you rightly assume the Fed will take falling inflation as a cue to take the foot off the brake and thus the economy in the not too distant future will head towards it's NEXT INFLATION PEAK, and then the central banks will rinse and repeat for the peak following that which WILL result in a very similar 10 Year inflation graph as that which occurred during the 1970's and that is what will deliver the DECADE LONG INFLATION PAIIN that few are prepared for!
Most will fail to understand that a 50% drop in the rate of the inflation from 9% to 4.5% is NOT GOING TO DO ANYTHING in terms of the addressing the relentlessly worsening Inflation PAIN that most are destined to suffer for the whole of this decade! WE ARE ONLY AT THE BEGINNING OF THIE INFLATION PAIN as the the above chart illustrates, barely begun the assent that is going to wipe out the purchasing power of earnings and savings.
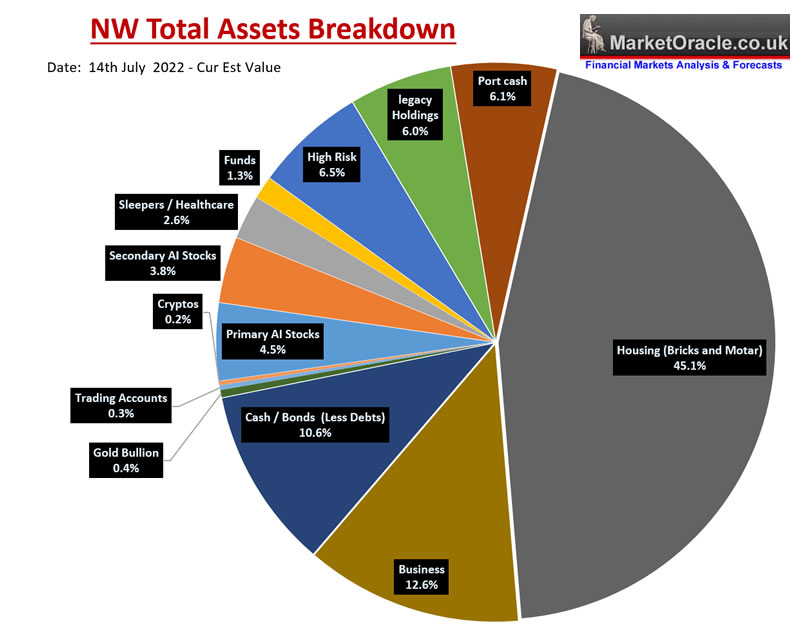
As for asset prices, to repeat one of my mantras, seek to be invested in assets that are leveraged to the inflation mega-trend that's Good stocks bought at fair valuations that can raise their prices, so basically one wants ones core portfolio to carry a LOW PE RATIO coupled with the potential for earnings growth, where my core AI stocks portfolio minus Amazon carries an average P/E of 16.6 that I expect earnings growth to continue to drive lower over the coming quarters.
And then there is HOUSING that cannot be PRINTED! Which is where the bulk of my wealth resides (45%), with stocks targeting 30%,Which will still leaves me with more than 25% in cash that I have to whittle down to under 15% hence why I dabbled with crypto's to a limited extent last year and recently logged into Binance to buy some more though only with existing funds on account rather than fresh funds which I will probably do so in the not too distant future as I do not want to invest more than about 30% in stocks because whenever my portfolio approaches 40% of assists I tend to become a less rational and hence tend to become eager to press the SELL button.
So feel free to comment below your suggestions for other asset classes apart form precious metals to investigate to avoid the inflation stealth theft as my last resort will be to seek to buy another property, but as you are probably already aware property is NOT CHEAP! And unfortunately I don't see what is going to deliver lower prices given INFLATION.
The bottom line is that peak inflation that the pundits are focusing on is a red herring, unless there is a miracle where by magic CP LIE falls to 2%, but then again 2% CPLIE is really 3.5% so perhaps we need to see CPLIE averaging 1.5% for the Inflation monster and it's consequences to be fully contained. Unfortunately perched here at 9%, I don't see sub 4% let alone sub 2% anytime soon. So don't be fooled by the talking heads when they sing the praises of CPI falling to 5% in a few months time, for it will actually have changed NOTHING! Go look at the 1970's where the first trough was at 3% and the second was at 5%, they did NOTHING to avoid the relentless climb to the Inflation mountain top! NOTHING! There is still time to act to protect our wealth.
China Financial Crisis 2.0 Simmering Black Swan
The Chinese property bubble continues to burst that I will cover in Part 3 of my housing market analysis. Suffice to say that this crisis continues to brew the background. So there IS a risk of a black swan event when the SHTF that could trigger a market panic event the probability of and timing of are unknowable to someone sat in the UK. What it means is to keep some power dry to capitalise upon such a panic event which I imagine will be met by a wall of money printing by the CCP.
AI Stocks Portfolio
Current state is 76.7% invested, target 85% by end of August 2022 , AI 49.6%, High Risk 27.3%, Cash 23.3%.I plan to add more cash equivalent to 5% by the end of August.
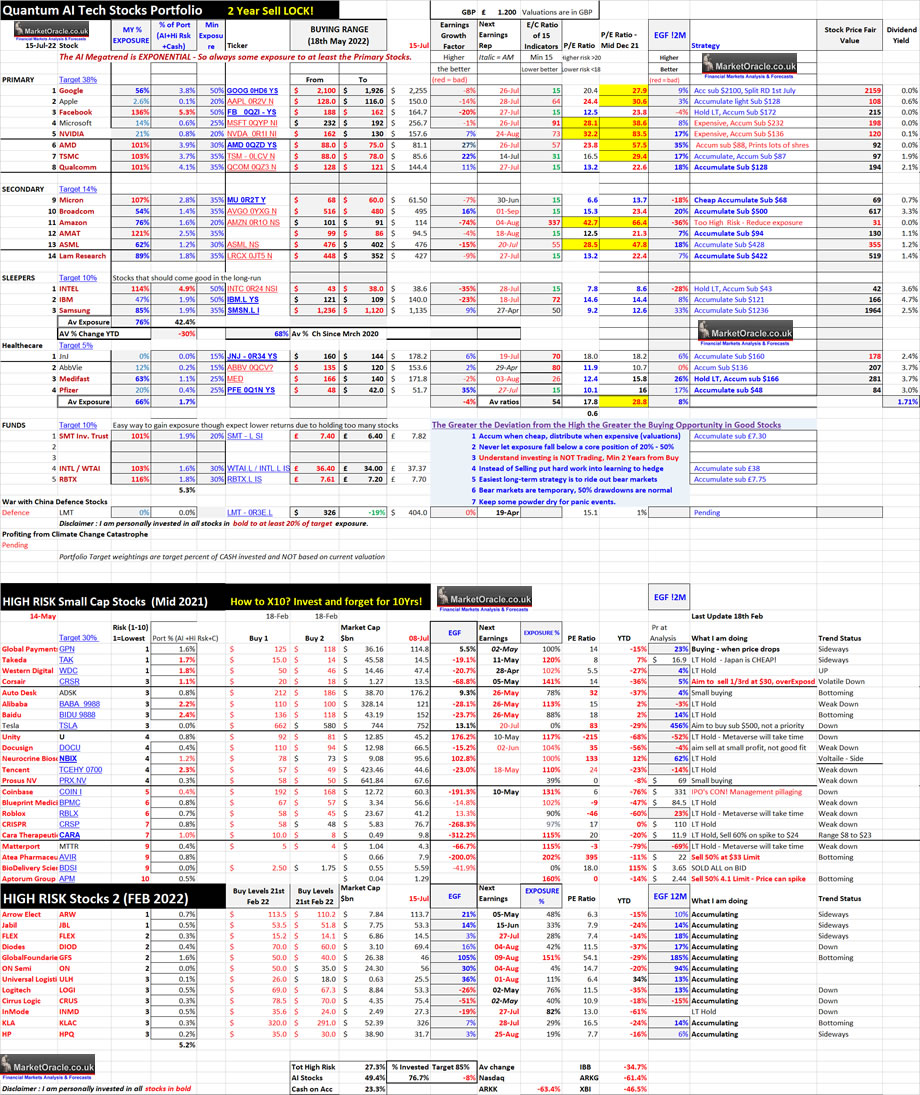
Table Big Image - https://www.marketoracle.co.uk/images/2022/Jul/AI-stocks-portfoli-15th-big.jpg
Earnings Week
Monday 18th July
IBM $140, EGF -23%, EGF12M +8%.
EGF implies to expect weak earnings. IBM stock price has been on a strong bull run since it's late February bottom, it will be interesting to see how the stock price reacts to probable weak earnings. Though I suspect the 4.7% dividend yield has a lot to do with it's strong performance as an Inflation hedge.
Tuesday 19th July
J&J $178, EGF +6%, EGF12M +6%.
EGF suggests strong earnings, so upwards price action. The stock price has shown relative strength, has come nowhere near it's upper buying level of $160.
Wednesday 20th July
ASML $476, PE 28.5, EGF -15%, 12mEGF +18%.
High PE coupled with probable weak earnings could deliver a buying op in ASML, 62% invested so I am seeking much lower prices for any significant buying, around $402 which is a +15% drop from its current price.
TESLA $720, EGF +13%, EGF12M +456%, PE 83.
EGF suggest strong earnings growth which could send the stock price above $800, I have yet to invest anything in Tesla due to it's high PE, in fact it has been one of the stocks I have tended to short most often and so I will probably short Tesla once from around $830. Whilst I may be tempted to start buying if I see sub $500.
Tuesday 26th July
Microsoft $256, EGF -1%, EGF12M +8%, PE 28.1, EC 91
EGF is neutral but Microsoft remains over valued on a PE of 28. My exposure is a light 14% as I await the big price drop to below $220 before I hit the big buy button. The High PE and EC is putting me off buying Microsoft.
Google $2255, EGF -8%, EGF12M +9%, PE 20.4, EC 15
EGF is weak so the stock price should fall on earnings. However the stock has been showing relative strength by making a series of higher highs and lows, albeit weak higher highs and lows. Can the stock price go up even when posting weak earnings? Oh nearly forgot the stock gets split Monday, so divide by 20.
What happens after hours on the 26th of July would chime well with my expectations for the probable termination of this bull run, so Microsoft and Google could be the triggers for the resumption of the bear market.
This anaysis Stock Market Rally Continues Towards Target, Why Peak Inflation is a Red Herring was first made available to patrons who support my work.So for immediate first access to ALL of my analysis and trend forecasts then do consider becoming a Patron by supporting my work for just $4 per month. https://www.patreon.com/Nadeem_Walayat.
Most recent analysis includes -
- Answering the Question - Has the Stocks Bear Market Bottomed? Saudi Black Swan
- Stocks Bear Market Rally End Game
- Qualcom Harbinger, AI Predicts Future Stock Prices 3 Years Ahead, China Bank Runs
- Stock Market Rally Continues Towards Target, Why Peak Inflation is a Red Herring
- Stocks Bear Market Rally Last Gasp Before Earnings Season, US House Prices 3 Year Probability Range
- The REAL Stocks Bear Market of 2022
Whilst my recent in-depth analysis is - UK House Prices Three Trend Forecast 2022 to 2025, where I pealed away every layer of the UK housing market I could think of to arrive at a high probability of trend forecast, no following of the consensus herd here! Whilst completion of my extensive analysis of the US housing market is imminent.
UK House Prices Trend Forecast 2022 to 2025
THE INFLATION MEGA-TREND
WE HAVE NO CHOICE BUT TO INVEST IN STOCKS AND HOUSING
High Inflation Forecast for Whole of this Decade Due to Rampant Money Printing
Fed Inflation Strategy Revealed
Russian Sanctions Stagflation Driver
RECESSION RISKS 2023
UK Debt Inflation Smoking Gun
Britains' Hyper Housing Market
UK Population Growth Forecast 2010 to 2030
UK House Building and Population Growth Analysis
UK Over Crowding Ratio
Overcrowding Implications for UK House Prices
UK Housing Market Affordability
UK House Prices Real Terms Sustainable Trend
UK House Prices Relative to GDP Growth
UK House Prices Momentum Forecast
UK House Prices and the Inflation Mega-trend
Lets Get Jiggy With UK INTEREST RATES
Is the US Yield Curve Inversion Broken?
UK house Prices and Yield Curve Inversions
Interest Rates How High WIll they Go?
Work From Home Inflationary BOOM?
Formulating a UK House Prices Forecast
UK House Prices 2022 to 2025 Trend Forecast Conclusion
Peering into the Mists of TIme
Risks to the Forecasts
US House Prices Trend Forecast 2022-2024
So if you want immediate access to a high probability trend forecast of UK house prices, with US and global housing markets analysis to follow soon then do consider becoming a Patron by supporting my work for just $4 per month. https://www.patreon.com/Nadeem_Walayat.
My Main Analysis Schedule
- UK House Prices Trend Forecast - Complete
- US House Prices Trend Forecast - 85%
- Global Housing / Investing Markets - 60%
- US Dollar / British Pound Trend Forecasts - 0%
- Stock Market Trend forecast into End 2022 - 0%
- High Risk Stocks Update - Health / Biotech Focus - 0%
- How to Get Rich - 85%

- Gold and Silver Analysis - 0%
- State of the Crypto Markets
Again for immediate access to all my work do consider becoming a Patron by supporting my work for just $4 per month. https://www.patreon.com/Nadeem_Walayat.
And ensure you are subscribed to my ALWAYS FREE newsletter for my next in-depth analysis.
Your terrified analyst that he will burn like a toast if he sets foot outside Monday afternoon!
By Nadeem Walayat
Copyright © 2005-2022 Marketoracle.co.uk (Market Oracle Ltd). All rights reserved.
Nadeem Walayat has over 30 years experience of trading derivatives, portfolio management and analysing the financial markets, including one of few who both anticipated and Beat the 1987 Crash. Nadeem's forward looking analysis focuses on UK inflation, economy, interest rates and housing market. He is the author of five ebook's in the The Inflation Mega-Trend and Stocks Stealth Bull Market series that can be downloaded for Free.


 Nadeem is the Editor of The Market Oracle, a FREE Daily Financial Markets Analysis & Forecasting online publication that presents in-depth analysis from over 1000 experienced analysts on a range of views of the probable direction of the financial markets, thus enabling our readers to arrive at an informed opinion on future market direction. http://www.marketoracle.co.uk
Disclaimer: The above is a matter of opinion provided for general information purposes only and is not intended as investment advice. Information and analysis above are derived from sources and utilising methods believed to be reliable, but we cannot accept responsibility for any trading losses you may incur as a result of this analysis. Individuals should consult with their personal financial advisors before engaging in any trading activities.
Nadeem Walayat Archive |
© 2005-2022 http://www.MarketOracle.co.uk - The Market Oracle is a FREE Daily Financial Markets Analysis & Forecasting online publication.