UK House Prices Crash by 14.6%
Housing-Market / UK Housing Oct 30, 2008 - 10:03 AM GMTBy: Nationwide
 Prices fall by 1.4% in October
- Reluctance of sellers to reduce asking prices could be hindering market activity
- Recognition that the UK is heading into recession opens door to sharp cuts in rates
| Headlines | October 2008 | September 2008 |
| Monthly index * Q1 '93 = 100 | 319.0 | 323.6 |
| Monthly change* | -1.4% | -1.5% |
| Annual change | -14.6% | -12.4% |
| Average price | £158,872 | £161,797 |
* seasonally adjusted
Commenting on the figures Fionnuala Earley, Nationwide's Chief Economist, said: “House prices in the UK fell for the twelfth consecutive month in October. The price of a typical house is now 14.6% lower than at this time last year, the peak of the market. The typical house price fell by 1.4% in October, around the same rate as the average monthly fall of 1.3% over the last year, but lower than the monthly falls recorded in each of the previous three months. The price of a typical house is now £158,872, almost £30,000 less than a year ago, but to put in context, still almost £30,000 more than five years ago."
 Housing turnover at lowest ever levels
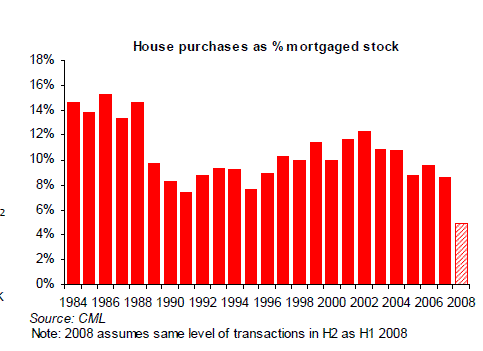
“The path of house prices is closely related to movements in the numbers of transactions. House purchase approvals dropped to new lows in the third quarter of the year, at around one third of the long run trend. The number of completed house purchase transactions as a proportion of the total stock of mortgages (the turnover rate1) is now at its lowest ever level since the series started in 1974. The latest data on the number of weeks taken to sell a property2 shows that this increased by more than 60% in the last year. It takes an average of almost 12 weeks to sell a property now compared to 7.4 weeks this time last year. In some ways this lack of activity is puzzling given that the last time turnover rates approached this level was in the early 1990s when market conditions appeared more hostile. In 1991 interest rates were at more than twice the level of today and general macroeconomic conditions were much worse. The economy was in deep recession and unemployment was well over two million. This suggests that there are other factors playing a part in the lack of activity in the current market.
Levels of supply no hindrance to market activity
 “The low rate of turnover is clearly not directly constrained by the overall supply of property on the market. Data from RICS has shown that during 2008 the stock of properties per agent has been at its highest level since 1998 and house builders are suffering from low levels of interest in new build properties too. A large overhang of supply does put downward pressure on prices and assists the market adjustment mechanism that leads to improved affordability and a return of activity. However, the sharp falls in prices recorded by the main transactions based measures of house prices has not yet led to an increase in market activity.
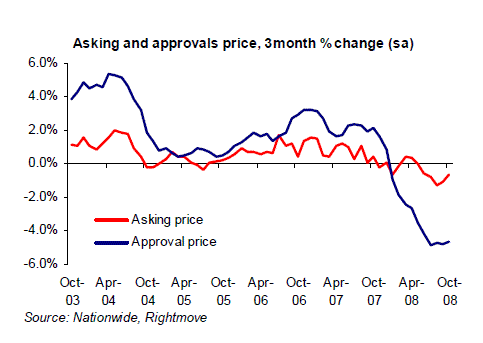
One possible explanation for this is that it is only those sellers willing to negotiate on price that are seeing sales go through. While others refuse to cut their price, the levels of activity are constrained. Asking prices have fallen this year but the rate of decline has been significantly behind that of other measures. Consumers still expect prices to continue to fall into 2009 and will therefore be reluctant to trade without some discount on the asking price. This type of stalemate ultimately limits the number of transactions which can take place. This could however indicate that conditions are not yet very stressed, as sellers have not felt the need to dramatically reduce their prices for a quick sale.
“As the economy weakens further there is likely to be more movement on asking prices as sellers adjust to the prevailing conditions and reassess their own needs. Some may choose not to sell after all, thus reducing supply, but others will adjust their prices accordingly. While there will always be a rump of sellers who will need to move in order to accommodate job or family changes there will be others who are affected by economic conditions more acutely. So we should expect a moderation of price expectations on the part of sellers in a weaker economic environment.
“Of course buyers’ ability to transact even at a lower asking price will depend on the availability and cost of finance. If recent actions on the part of central banks help to stimulate mortgage funding this could ease up the cost and availability of finance to borrowers in the higher LTV bands. This would be particularly helpful for first time buyers. The latest data shows there are about 55% fewer than at the same time last year. A return of these borrowers would help to stimulate activity in the market both through their own purchases and by helping others to transact by shortening chains and helping others to complete their purchases.
Bumpy times ahead for the UK economy signal sharp rate cuts
“Now that official data has confirmed that the UK experienced a bigger than expected decline in output in the third quarter, there is little doubt that the economy is heading into recession. Continuing turmoil in global financial markets and bailouts of whole economies by the IMF highlight the unprecedented nature of the current conditions and signal that there is likely to be a bumpy ride ahead; a fact echoed by both the Governor of the Bank of England and the Prime Minister in recent speeches.
“A looming recession and continued financial market instability have uncomfortable implications for the housing and mortgage markets, and will undoubtedly affect the pace of recovery in house prices. However the speed of the economic slowdown and the determination on the part of central banks to return stability to the financial markets does mean that interest rates are likely to continue to be cut sharply which will make life easier for borrowers on variable rate loans and those coming to the end of fixed rate deals. The half percentage point reduction in October will not be the last rate cut of 2008 and the possibility of even deeper cuts this year is increasing as the Bank of England attempts to prevent a deep and prolonged recession. We believe rates will be cut by at least 50bp in the last two months of this year, but would not rule out larger moves, particularly if further co-ordinated action by central banks is warranted.”
| Fionnuala Earley Chief Economist Tel: 01793 656370 fionnuala.earley@nationwide.co.uk |
Roy Beale Media Relations Officer Tel: 01793 655689 roy.beale@nationwide.co.uk |
Notes: Indices and average prices are produced using Nationwide's updated mix adjusted House Price Methodology which was introduced with effect from the first quarter of 1995. Price indices are seasonally adjusted using the US Bureau of the Census X12 method. Currently the calculations are based on a monthly data series starting from January 1991. Figures are recalculated each month which may result in revisions to historical data. The Nationwide Monthly House Price Index is prepared from information which we believe is collated with care, but no representation is made as to its accuracy or completeness. We reserve the right to vary our methodology and to edit or discontinue the whole or any part of the Index at any time, for regulatory or other reasons. Persons seeking to place reliance on the Index for their own or third party commercial purposes do so entirely at their own risk. All changes are nominal and do not allow for inflation. More information on the house price index methodology along with time series data and archives of housing research can be found at www.nationwide.co.uk/hpi
Nationwide Archive |
© 2005-2022 http://www.MarketOracle.co.uk - The Market Oracle is a FREE Daily Financial Markets Analysis & Forecasting online publication.


