Stock Market on the Launch Pad for Post CPI To the Moon Rally
Stock-Markets / Stock Market 2023 Jan 24, 2023 - 10:15 PM GMTBy: Nadeem_Walayat
Santa's Stock Market sledge is on the launch pad, t-minus 2 hours to go until release of November CPI data at 1.30pm UK time. Octobers release was 7.7%, consensus for November is for 7.3%, and 6,1% for Core CPLIE. A quick review of the monthly data suggests to expect CPI of 7.4%, so whilst not a beat would be a relief that CPLIE is at it's lowest since November last year, so would be taken as a cue for SANTA to deliver the last leg of the rally off the October low that has already achieved my base case target of 4100 thus should set the scene for the over shoot phase to at least 4160, with ample time to propel stocks for an assault on S&P 4200, break of which we would send stocks into the FOMO phase that would target a break of the August high of 4316 which has basically been my view for over month.
Therefore my expectations are for Santa to take the rally a notch higher north of 4100, for an over shoot to about 4160, beyond which is the 4200 barrier above which FOMO froth, that could be triggered by CPI of 7.2% or lower, though that is not what the actual data suggests toe expect, i.e. 7.3% or 7.4% looks more probable. Still it is good to remember that the S&P has already had a 17.7% bull run off it's MId October low of 3481 to it's recent high of 4100, so to achieve 4160 and above would be the icing on the cake. Swing projections that have proven reliable concur with this outlook by projecting to 4340 into the end of the year.
The risk is that Grinch steals Christmas if CPLIE comes in at 7.5% and higher, it's going to be a nail biting few minutes in the run up to 1.30pm (UK time) and that I error correct and proof read this article to post well before release of CPI data! As I write I have 2 hours to go so should be doable.

However as I have been flagging all year, looking at indices such as the S&P is a mistake which is why I only look at an index if I am trading it rather then to use the the index as a cue to buy and sell individual stocks as the following chart of the Top 10 AI stocks illustrates that there is a huge spread in performance against the S&P with Nvidia on a whopping +48% advance since Mid October to META having fallen by 9% over the same time period with a wide spread in between with only Qualcom matching the S&P.
Chart big version - http://www.marketoracle.co.uk/images/2022/Dec/AI-stocks-big.JPG
So once more do not make the mistake of focusing on the indices, as if it is any substitute for keeping ones eyes on the actual stock prices for if you do then you will miss most of the big buying opportunities as those who perhaps waited for the S&P to flash a buy signal on a cross above 4000 to buy the likes of Nvidia, AMAT, AMD and so on, for if they had they would be shocked to see that their target stocks are already up between 25% and 50%!
Stock Market Trend Forecast Big Picture
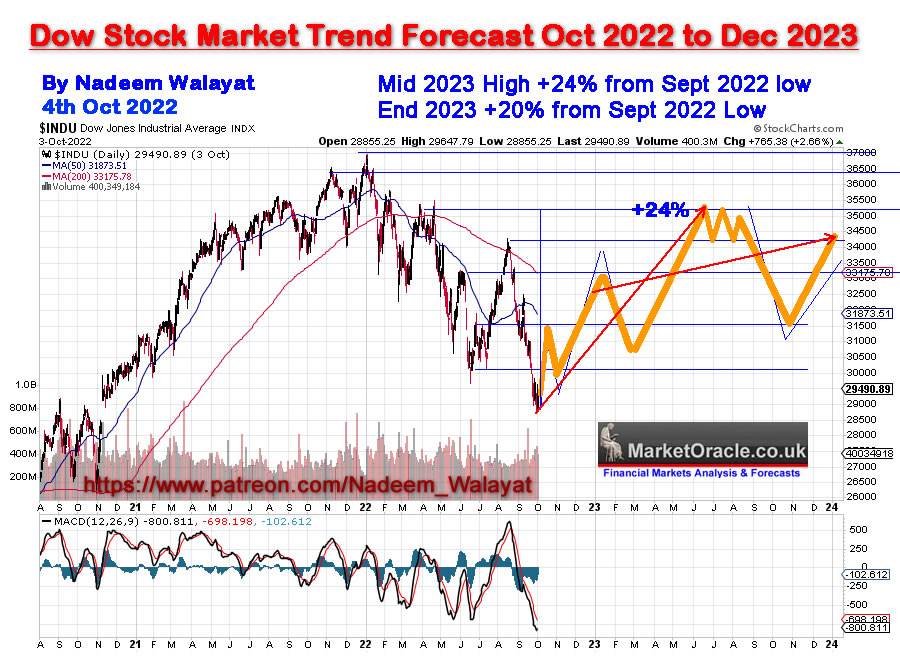
It's now over 2 months since I posted my in-depth analysis and concluding trend forecast into the end of 2023.
- Stocks Bear Market Max PAIN - Trend Forecast Analysis to Dec 2023 - Part1
- Stock Market Analysis and Trend Forecast Oct 2022 to Dec 2023

The forecast for 12th of December would have the Dow at be 1800, against the actual close of 34,000. What does this imply? That the herd collectively expecting much lower stock prices during 2023 could prove to be badly WRONG! i.e. the +2k deviation is warning of UPSIDE surprise during 2023, price levels that one cannot even imagine today well north of the Dow's all time high of 37k, 40k?. This is the beauty of trend forecasts in that there is NO HINDSIGHT, the Dow stocks at least appear itching to trade to NEW ALL TIME HIGHS.
So the Dow continues to outperform the forecast and against the other indices such as the S&P which in terms of the trend forecast pattern i.e. forecast Dow levels vs equivalent S&P would projects to the S&P trading at 4015, right now which is very close to the S&P's last close of 3990. Whilst the the forecast Mid January peak translates into S&P 4190.
AI Stocks Portfolio
Current state of the portfolio has me 90% invested, 10% in cash, exposure lifted via a series of small buys in the likes of Amazon, Tesla Crispr and Qualcom.
Tesla in particular took a tumble to it's bear market low, Tesla clearly wants to gravitate towards $150 but is being supported by the market rally, most likely trend pattern is for Tesla to trade within a range of $200 to $150. I am now 101% invested! That was quick! I was at zero exposure not so long ago! I will add more Tesla should it trade towards $150, the stock likes round numbers so I am not expecting sub $150 any time soon, but longer-term we should see sub $130 as bad earnings numbers come in during 2023, so I will reduce exposure on a rally to above $200 towards $280.
I have rearranged some of the columns to make the presentation of the 3 portfolios more uniform and easier to read.

Table Big Image - https://www.marketoracle.co.uk/images/2022/Dec/AI-stocks-portfolio-12.jpg
The following graph better illustrates how my holdings breakdown across the AI tech stocks, witch Google my largest holding followed closely by AMD and so on.
How do I best utilise the AI stocks table on the fly to be instantly aware of the current state of each stock, i.e. which to accumulate. which to trim. The columns I utilise are EGF, EGF 12 month, and the PE ratio relative to the Mid Dec PE and a bear market low PE which currently is the early October update PE. By glancing at these 5 columns I am aware of the probable direction of travel and thus act accordingly.
First the EGF's - A positive number implies to expect earnings growth and thus upwards pressure on prices ahead, where the higher the number the more upwards pressure. Whilst a negative number is downwards pressure i.e. the stock is likely to under perform.
Next is the PE ratio relative to where it has traded in the recent past i.e all stocks on a particular date rather the the exact highs or lows so that valuations are RELATIVE. So if a stock is for instance strong BLUE on the EGFS and LOW on the PE range then I am unlikely to trim that stock and more likely to accumulate more. Conversely if a stock is STRONG RED with high PE then I am more likely to trim said stocks,
Other factors at play are the EC Ratio which shows how expensive or cheap the stock is relative to others, this is more useful during a bull market as during a bear market most of the stocks have become CHEAP, and thus trade on the minimum reading of 15, still it is useful in flagging outliers such as Amazon to be wary of.
The the next metric would be my exposure, if under 100% of target then I am more included to accumulate than if over 100% invested.
The buying ranges also play a factor in that I tend to hold off significant buying unless stocks are trading in the buying range based on technical factors, note the buying ranges tend to change as they follow the price lower, so no point in referring to a buying range of say 9 months ago and applying it to the present as some tend to do, here black denotes a buying level that was achieved and RED that remains pending i.e. Nvidia traded to below $122 hence black whilst never traded to $102 hence red. So as of 22nd of Sept, I would be a strong buyer of Nvidia below $122, where the further it fell the more I bought.
So what do these metrics say for key stocks today?
TSMC - Blue, Blue, Low PE, Low EC, High Exposure, would make me reluctant to TRIM whilst also reluctant to accumulate more due to high exposure.
AMD - Red, Red, Low PE, High EC, Very High Exposure - I would be eager to trim and reluctant to add to AMD as the EGF point to lower earnings ahead.
NVIDIA - Red, Blue, High PE, High EC, Low Exposure - I would trim some on a further rally, and would be reluctant to add more unless I see sub $122 despite only being 57% invested.
Microsoft - Blue, Blue, High PE, High EC - Reluctant to add unless I see sub $226 and even then only towards a target of 50%.
Google - Red, Red, Low PE. Low EC - I case of gravitate towards 100% invested, so would trim on a rally to above $110, and not look to add more given 119% exposure.
Apple - Blue, Blue, High PE, High EC - A case of accumulating on the dips to get to at least 25% invested, would not go beyond that unless I see sub $122.
Broadcom - Blue, Blue, Low PE. Low EC - Eager to accumulate more say on a dip below $490, so would not wait for the buying levels to buy more.
ASML - Blue. Blue, High PE, High EC - the stock is expensive, but growing, I would trim this stock near current and a little higher, even though only 88% invested.
AMAT - Red, Red, Mid PE, Low EC - The stock is well off it's low but to trim I would need to see it become more expensive, I would basically just hold what I own as it is nowhere near where I would trim or buy more.
And that's how I quickly read the current state of each stock, spending no more than a few seconds on each stock to know where they stand all without looking at any stock charts.
Obviously the stocks with the best metrics right now are TSMC and Broadcom so I would be very cautious in trimming either of these.
Whilst the worst are Nvidia, Amazon and Intel where it's current PE is higher than Mid Dec 2021 as Gelsinger plows free cash flow into capex as part of the chip fab war, it does not help TSMC building another fab in the US, though there TSMC will be up against Intel on it's home turf so it's not a done deal that TSMC can replicate in the US what they have in Taiwan.
CHANGE the Way You Think About Profit and Loss
From the comments section many patrons appear eager to trim holdings. However, this is a dangerous game and mindset to have one of selling on a few percent gain on fears that that smaller profit will evaporate into a loss.
Think about it?
If you follow this investing mindset what kind of portfolio will you end up with?
You will have a portfolio where you have sold all of your winners and are only left holding losers!
This is probably down to the way humans are hardwired to avoid pain, i.e. eat the food now rather than it be stolen or lost in the future.
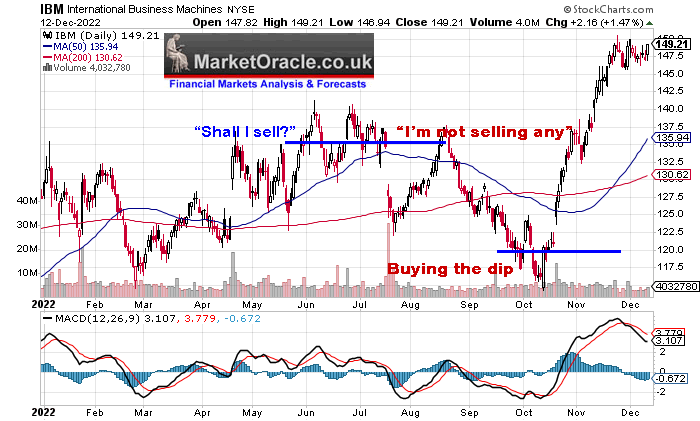
My solution is to aim to have a target holding to aim for i.e. to be 100% invested, thus the further below 100% the more uncomfortable I am in wanting to sell (take profits) because I don't hold enough exposure. This is one of the reasons why I have held onto my approx 50% exposure to IBM for the duration of the bear market as every time IBM outperforms I get comments asking shall I sell my IBM, where my response has been I'm not selling any IBM because I don't hold enough! And similar for others that are sub 100%. And don't even think of saying "but you could have sold at $135 and bought back at under $120", yes in HINDSIGHT! AFTER THE FACT!

Conversely the mechanism for SELLING is OVER EXPOSURE! i.e. when a stock is cheap such as TSM trading to below $70 I am far more inclined to ADD rather than to SELL! Which is what some patrons were asking at the time, i.e. Shall I sell TSM to buy AMD etc... Where my response is I don't sell ANYTHING at a LOSS! I would much rather the stock to go to ZERO than SELL and for ever by jumping from one stock trading near it's lows to another! What is that going to result in? SELLING EVERYTHING NEAR THE LOWS! Yes there is no sure fire bet, and all stock prices oscillate around earnings and fair value between extremes of over valued and under valued, but I would much rather lose it all then SELL a stock for a loss as I wrote several years ago when constructing the High Risk Portfolio, a case of HERO or ZERO, 0 or X10. no inbetweens!
Anyway my mechanism to deal with the human conditioning to sell for a small profit on fears of the profit turning into a loss is OVER EXPOSURE! To invest beyond 100% of target and thus I have leeway to either
1. Trim holdings on a rally so as to increase cash on account for further opps down the road.
2. To allow me to evaluate my maximum exposure at a later date, for instance I have decided to increase my target exposure to KLAC by about 15% which drops my over exposure from 135% down to 120%, all without having to wait for a dip to buy more exposure.
This is why I don't use stop losses when investing, as if I had they would have kicked me out of everything near the lows! Lam Research at sat $330. AMAT at say $80, TSM at $60 and so on.
Another solution to the trimming problem is that I trade futures and options, TRADE being the operative word, thus let investments ride whilst I spin my wheels on futures and options on the likes of the S&P.
Crypto Contagion
Everything the crypto maniacs have touted for the best part of decade has turned out to be FALSE! Crypto platforms have turned out to be the SAME as the banking crime syndicate but without a central bank to bail them out with tax payers dollars! The same reason of over leveraged financial institutions collapsing like dominos into 2008 as the value of their assets collapsed making them bankrupt is happening to the crypto-verse One by one they are dripping like flies and given that there is no back stop, this could consume ALL Platforms that are leveraged to crypto prices which include the biggest names in crypto such as Gray scale and Binance! Any platform that is leveraged to crypto prices is at risk of bankruptcy, Where the only thing that can save them is if crypto prices started going up!
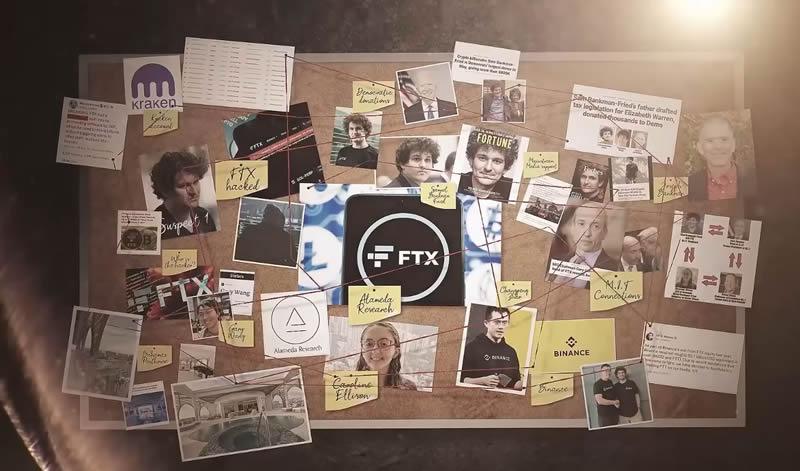
SBF, you are going to prison for decades delusional dude!
The lower the bitcoin price falls the greater the contagion risk becomes and more platforms will go bankrupt as the value of their assets fall below the amount they have borrowed, or stolen off platform users as was the case with FTX. What's worse is that they have lent crypto's and funds to one another and so just like the banks are at counter party risk that could see this crypto crisis end the same was as the financial crisis though without a tax payer bailout with the latest alarm bell ringing around CONBASE and USDC unstable coin as CONBASE encourages users to convert to USCD fee FREE out the goodness of their heart. Yeah sure! This is very fishy and implies USDC is in trouble as I warned patrons in the comments to avoid USDC.
What I have done is to move most of what little crypto I had on Binance into a software wallet (Trust), yes this incurs a transaction fee but better that than to wake up to zero!
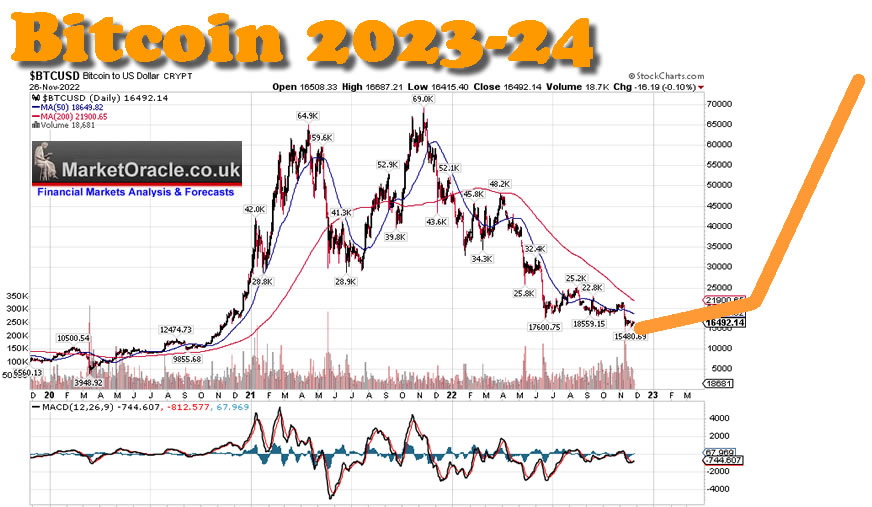
The bottom line is this does not bode well for any imminent return to crypto bull run because too many distressed over leveraged players are praying for higher prices to save their over levered butts. The worse of the crypto storm may lie ahead as bankrupting platforms and lenders are forced to sell collateral (bitcoin and other corruptos) in a panic / Bitcoin is currently trading at $17k, such a panic event could see it spike to below $10k! How low we will only know with the benefit of hindsight, $6k? The more crypto exchanges that fall the more forced selling of crypto's will take place.
What will I be doing? BUYING THE CRYPTO PANIC to a limited extent after all they have no intrinsic value i.e. fundamental value is probably ZERO. So I will set some distant limits ranging down from st $13k down to 9.5k and see what gets triggered, much as I covered in my article of a month ago.

AND take this as cautionary tale, DO NOT INVEST ON LEVERAGE! Because if you cannot invest and forget then you are NOT investing you are TRADING! And that is a whole different ball game!
Crypto's latest - Binance has just suspended withdrawals into USDC stable coin barely days after I warned in the comments that something fishy was going on with CONBASE and USDC given that CONBASE was encouraging conversion into USDC which smelled like the stable coin was under extreme stress. What to do? Cancel any crypto sell orders INTO USDC and move your crypto OFF exchange into software wallets. Note you are not actually moving the crypto onto your app's, what you are doing is moving ones holdings onto the blockchain's, and all that the APP holds are your private keys that resolve from your unique 12 word phrase.
This is the problem with the cryptoverse, it is rotten to it's core which becomes apparent during bear markets when there is no fresh flow of funds to feed the ponzi schemes, hence they explode FTX style and likely worse to come.
This article Santa Sledge on the Launch Pad for Stock Market Post CPI To the Moon Rally was was first made available to patrons who support my work.So for immediate first access to ALL of my analysis and trend forecasts then do consider becoming a Patron by supporting my work for just $4 per month. https://www.patreon.com/Nadeem_Walayat. Lock it in now as $4 per month as this soon rises to $5 per month.
To get immediate first access to ahead of the curve analysis as my extensive analysis of the stock market illustrates (Stocks Bear Market Max PAIN - Trend Forecast Analysis to Dec 2023 - Part1), that continues on in the comments section of each posted article, all for just 4 bucks per month which is nothing, if you can't afford 4 bucks for month then what you doing reading this article, 4 bucks is nothing, if someone did what I am doing then I would gladly pay 4 bucks for it! Signup for 1 month and you will see what I do cannot be beaten by those who are charging $100 per month! I am too cheap! I am keeping my analysis accessible to all, those willing to learn because where investing is concerned the sooner one gets going the better as portfolios compound over time, 4 dollars month is nothing for what you get access which will soon rise to 5 dollars per month for new patrons so at least give it a try, read the comments, see the depth of analysis and you won't be sorry because i do do my best by my patrons, go the extra mile which you will soon see.

And gain access to the following most recent analysis -
- Stock Market Rally Slams into Q4 Earnings Season
- Stock Market Gasping to Reach 4000 Ahead of Earnings Season, Dow New All Time High 2023?
- S&P500, Gold, Silver and Crypto's Trend Forecasts 2023
- Santa Battles Grinch to Deliver Stock Market Last Gasp Rally into the New Year
- Santa Sledge on the Launch Pad for Stock Market Post CPI To the Moon Rally
- Stocks Analysis Bonanza - GOOG, QCOM, ASML, TCHEY, BABA, BIDU, TSLA, WDC, RBLX, MGNI, COIN, BITCOIN CAPITULATION!
- Stocks Bear Market Max PAIN - Trend Forecast Analysis to Dec 2023 - Part1
- Stock Market Analysis and Trend Forecast Oct 2022 to Dec 2023 - Part 2
So for immediate first access to to all of my analysis and trend forecasts then do consider becoming a Patron by supporting my work for just $4 per month. https://www.patreon.com/Nadeem_Walayat that is imminently set to rise to $5 per month for new patrons.
My Main Analysis Schedule:
- UK House Prices Trend Forecast - Complete
- Stock Market Trend Forecast to December 2023 - Complete
- US House Prices Trend Forecast - 80%
- Global Housing / Investing Markets - 50%
- US Dollar / British Pound Trend Forecasts - 0%
- High Risk Stocks Update - Health / Biotech Focus - 0%
- State of the Crypto Markets
- Gold and Silver Analysis - 0%
- How to Get Rich - 90%

Again for immediate access to all my work do consider becoming a Patron by supporting my work for just $4 per month. https://www.patreon.com/Nadeem_Walayat. Lock in now as this increases to $5 per month in the new year.
And ensure you are subscribed to my ALWAYS FREE newsletter for my next in-depth analysis.
Your mega-trend investing analyst.
By Nadeem Walayat
Copyright © 2005-2023 Marketoracle.co.uk (Market Oracle Ltd). All rights reserved.
Nadeem Walayat has over 30 years experience of trading derivatives, portfolio management and analysing the financial markets, including one of few who both anticipated and Beat the 1987 Crash. Nadeem's forward looking analysis focuses on UK inflation, economy, interest rates and housing market. He is the author of five ebook's in the The Inflation Mega-Trend and Stocks Stealth Bull Market series that can be downloaded for Free.
 Nadeem is the Editor of The Market Oracle, a FREE Daily Financial Markets Analysis & Forecasting online publication that presents in-depth analysis from over 1000 experienced analysts on a range of views of the probable direction of the financial markets, thus enabling our readers to arrive at an informed opinion on future market direction. http://www.marketoracle.co.uk
Disclaimer: The above is a matter of opinion provided for general information purposes only and is not intended as investment advice. Information and analysis above are derived from sources and utilising methods believed to be reliable, but we cannot accept responsibility for any trading losses you may incur as a result of this analysis. Individuals should consult with their personal financial advisors before engaging in any trading activities.
Nadeem Walayat Archive |
© 2005-2022 http://www.MarketOracle.co.uk - The Market Oracle is a FREE Daily Financial Markets Analysis & Forecasting online publication.


