Stocks Bull Market Milestones
Stock-Markets / Stock Market 2023 Mar 06, 2023 - 09:14 PM GMTBy: Nadeem_Walayat
The Chat AI War has begun! You thought it was game over with Open AI GPT? That is just the start! In fact I consider GPT a toddler compared to Google's Einstein! Because GOOGLE MONETIZES their AI to the tune of $40 billion per quarter! It's called Google SEARCH! Whilst Microsoft is onto a winner of sorts, however it isn't going to even come close to dethroning Google!
Woo hoo mission accomplished on run to S&P 4040! What mission? Trimming! Cash on accounts up from 7% a couple of weeks ago 10.8% today, trust me having adequate cash on account makes a big difference to ones investing psychology, the difference between fearing price drops to anticipating them even if one is near 90% invested, so maybe those skimming along at near 100% invested need to look into trimming, for me 12% cash is my current goldilocks zone as a function of the accounts I hold i.e. a wide spectrum from those designed for high turnover such as Etorro right trough to the glacial Interactive Investor and AJ Bell where one is reluctant to act due to rip off fees, which is actually a good thing for the long run.
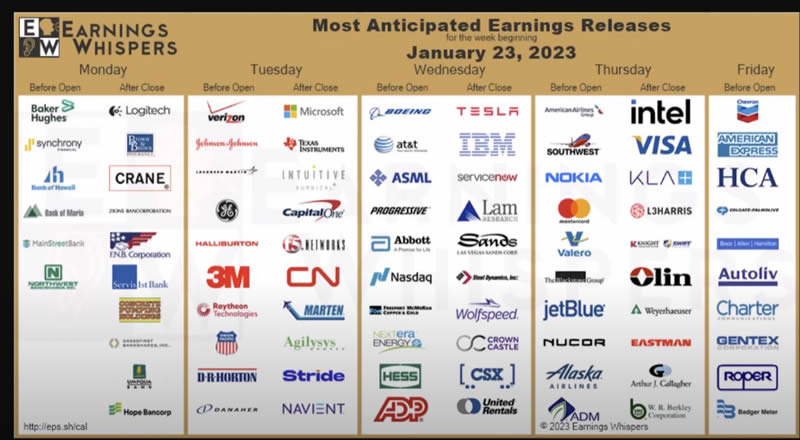
It's earnings season and where the AI stocks portfolio is concerned kicks off today with the GPT Microsoft soon followed by IBM, LRCX, Tesla on Wednesday, Intel Thursday which are just the starter for next weeks main course Google, AMD, Qualcom, Facebook, Apple, Amazon with many more medium and higher risks reporting.
But first the current state of the bull market and how earnings could impact the likes of the S&P as on face value the EGF's paint a bleak picture of contracting earnings for most stocks, which I am sure are being discounted by the market to some degree, however the risk of worse then expected results or in future guidance sows the seeds for much uncertainty even as inflation and bond yields fall encouraging some FOMO to creep back in that as usual caught the Cartoon Network (CNBC) off guard, you can it see it in their eyes, they don't have a clue what's going on!.
Current State of the Bull Market
The Dow closed Monday at 33,629 vs the trend forecast road map of 32,750, so the Dow continues to show a positive deviation against the forecast of +2.7%, up from the +2.2% deviation as of 9th of Jan.
- Stocks Bear Market Max PAIN - Trend Forecast Analysis to Dec 2023 - Part1
- Stock Market Analysis and Trend Forecast Oct 2022 to Dec 2023
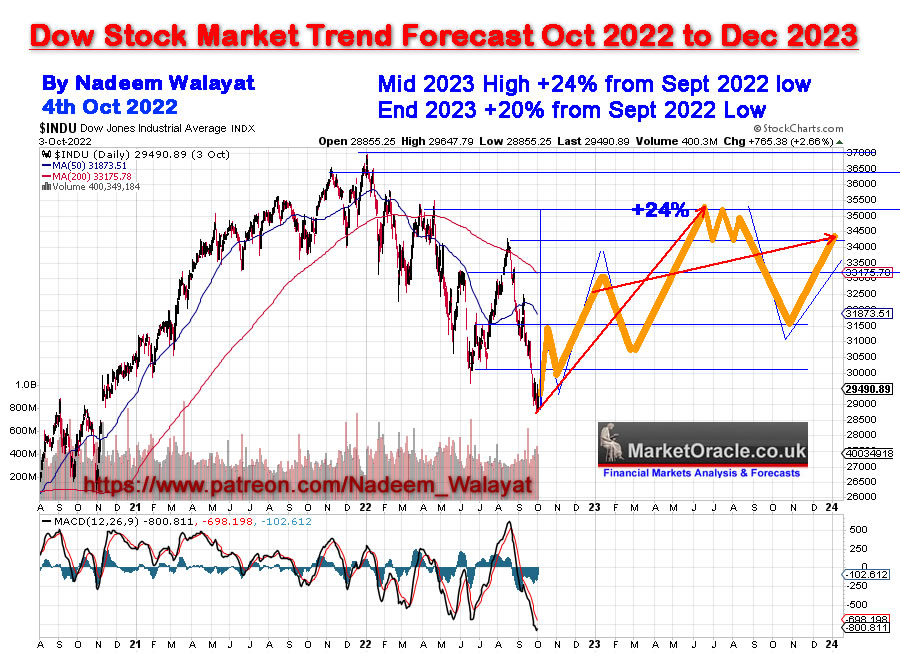
Dow Bull Market milestones SINCE my forecast road map was posted -
1. Higher high above 34,300 - check
2. Santa rally - check
3. Up first 5 days of January - check
4. 50day SMA cross above 200 day - check
So the Dow so far continues to confirm my trend forecast that expects the pre-election year of the Presidential cycle to deliver a strong bull run which given the positive deviation could even see the Dow trade to a new all time high this year! This vs the doom and gloom of rate hikes, recession, depression, Ukraine war, not to mention China buzzing Taiwan sowing much doubt and confusion as evidenced by comments that this or that analyst said x y and z such as Roubini, where my response is typically I could not careless, in fact I don't want to know what the likes of perma doom Roubini is spouting nor anyone else as all it does is SOW UNCERAINTY when what I one seeks is CERTAINTY so as to act with conviction! This is why most folks miss whole bull markets because they are exposed to a CLOUD of UNCERTAINTY! He said she said sells sea shells by the sea shore.... mind numbing is what it is, not figuratively but LITERALLY! All whilst the bull market continues to stealthily check the boxes the next of which will be to close January UP on the month, which for the Dow would be above 33,147 and the S&P above 3839, so something to keep ones eye on.
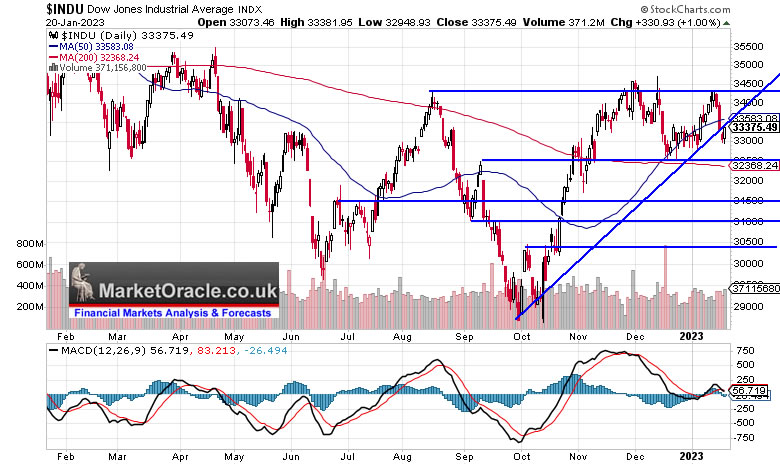
Note most charts are as of Friday 20th January - (Charts courtesy of stockcharts.com)
In terms of the current trend the Dow failed to break to a new bull market high during the current Up swing that sets the scene for the correction down to at least 32,500 which is in line with my road map where the bulk of the decline should manifest during February given that the Dow 'should' tick the January UP close check mark by ending January above 33,147.
This article Stock Market Rally Slams into Q4 Earnings Season was first made available to patrons who support my work.So for immediate first access to ALL of my analysis and trend forecasts, including new near daily market briefs then do consider becoming a Patron by supporting my work for just $5 per month. https://www.patreon.com/Nadeem_Walayat.
S&P Trend
Again if you don't check the patreon comments section then you are missing out on a lot of timely short-term trend expectations, for instance last Thursday pre-open I posted -
S&P500 - 3921 - Repeatedly FAILED to break above 4015 last high, where I was seeking 4020 as confirmation of a break. Failed to break higher three times! Each failure opened the door for selling towards the bottom fo the 3900-4000 range. Below is the minor low of 3910, that given were we are perched could break. However, the window for a rally remains open for 2 more days!
THE FUTURE - I am expecting another attempt to break above 4000 however that will likely fall short with the S&P topping out at between 3970 to 3990, with my eyes converging on 3985 that will mark the start of the correction proper towards the target to trade below 3760.
Friday pre-open -
S&P - 3904 - Same as yesterday, targets a rally towards 3970-90 and likely closes Friday around 3950.
So if you are interested in the short-term then do check out the comments as I post my view pre-open most days.
The S&P has fulfilled my objective of spiking to above 4000, reaching a high yesterday of 4040, after bouncing around within the 3900 to 4000 range, the only thing unexpected so far is that I expected the spike above 4000 to take place last Friday i.e. into options expiration, instead it took place yesterday, hence the delay in the sending of this article that had been scheduled to be posted early Monday. Anyway the window for the expected rally has now passed so the next direction of travel should be lower.
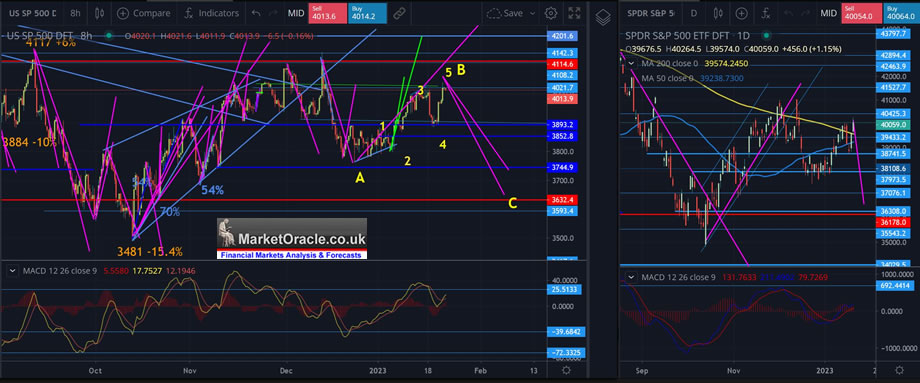
Big Image - https://www.marketoracle.co.uk/images/2023/Jan/sp-23-big.JPG
The current state of play is that the S&P rallied to over 4000 to pull in FOMO retail investors and stop out shorts. In fact even Elliott Wave is painting a pretty straight forward pattern for an ABC correction where the current rally is Wave B ahead of an imminent Wave C..
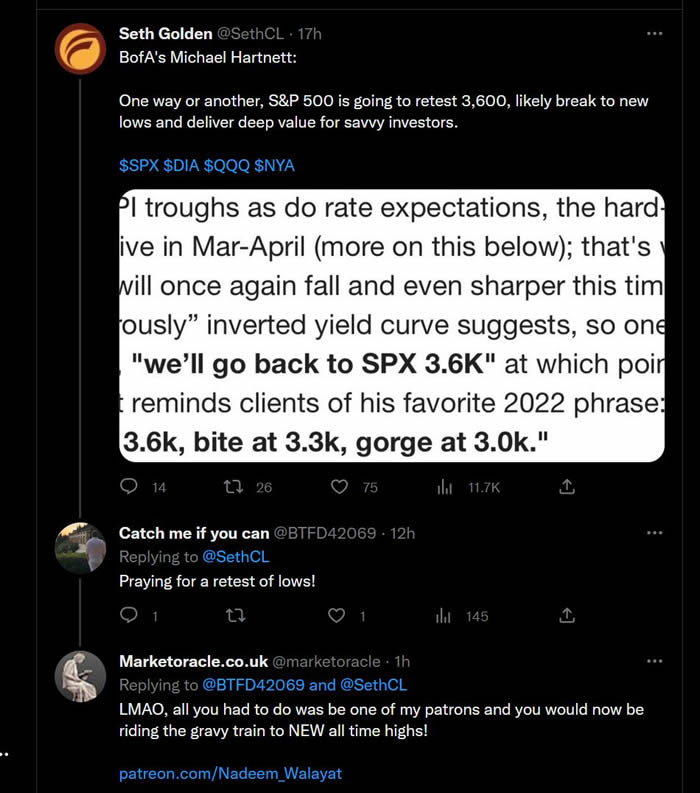
Swings analysis projects down to between 3632 and 3745 which is in line with my long standing base case for this correction to target a move to 3760 to 3700, so nothing has changed! All we got was a very volatile trend that was aimed at stopping out the LONGs below 3900 and the SHORTs above 4000. Thus I am expecting the S&P at the very least to target 3860 to break the last low. And given the weight of price activity around 3800 I would now revise my base case to 3800 to 3750 as being necessary to stop out weak longs so as to lay the ground by Mid February for the next up leg of this stealth bull market that I have been laying the ground work towards by trimming, opening a few covered shorts and S&P put options. Ideally the S&P will trade down into this zone by Mid February for a pattern of contracting downswings and expanding upswings which is what one expects to see in a bull market i.e. a fall to 3760 would be -6.9% vs the last upswing of +7.8%. Thus the Up swing that follows will be greater than +7.8% for a rally to new bull market highs during summer 2023 which could even see the Dow set a new all time high! All whilst indecision reigns supreme on the likes of twitter in a perpetual waiting for a magic signal with the goal posts constantly drifting as those who failed to act when the knives were fast falling desperately cling onto hopes of the likes of 3600 and lower to buy though if it ever happened they would once more be too fearful act just as they were the last time S&P traded down to S&P 3600.
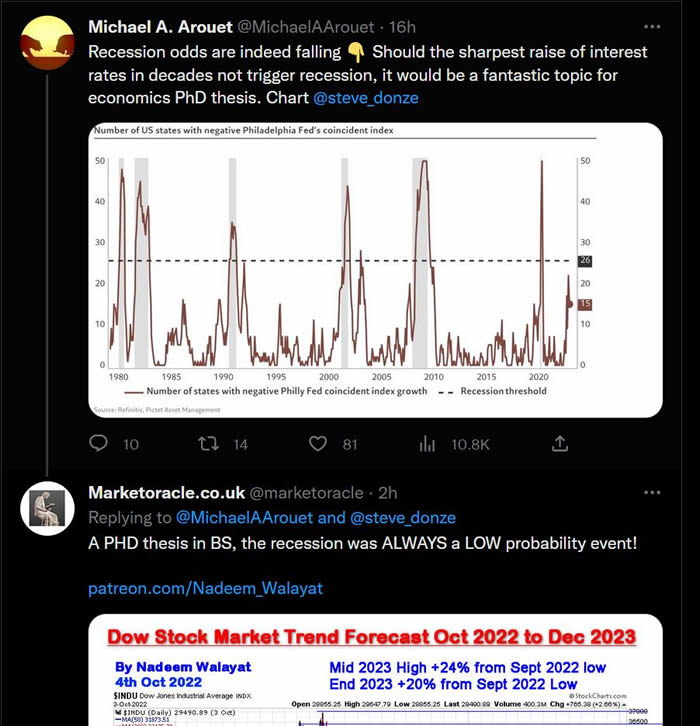
And apparently if a recessions fails to materialise during 2023 (my base case) then many PHD thesis will be written about it.
What about the risks to this scenario? We are in a BULL MARKET so the risks are to the UPSIDE, one of an explosive rally as fund managers who have badly gotten the market wrong panic buy propelling the Stock market driven by FOMO rather than reasoned analysis to far higher than the likes of TA can conjure through lines on a chart as I warned in my last article.
Also a reminder that the monthly Patron fee will imminently rise to $5 per month for NEW patrons only, so all existing patrons will continue on their existing tier. Whilst I note that Chat GPT have just hiked their fee by infinity from zero to $42 per month! That is a big hike! So much for MSM mantra that Chat GPT could put Google out of business! Google can make $40 billion a quarter without charging users a single penny!
And remember GPT3 is just the tip of the ice-berg -
- OpenAI's GPT-4 is coming.
- AnthropicAI's 'Claude' is coming.
- DeepMind's 'Sparrow' is coming.
- Text-to-Video is coming.
- Stability AI is cooking.
Google remains numero uno!

AI Stocks Portfolio Earnings Season - Buy the Rumour Sell the News?
The AI stocks portfolio's EGF stats have been updated ahead of Q4 earnings season that paint a picture for widespread negative earnings expectations so given that stocks have rallied ahead of earnings then it's a case of buy the rumour and sell the news into at least early February. And as requested I have updated the Buying Ranges for AI and Medium risk stocks though most remain as they were last updated on 22nd September and also updated the strategy column given that it was last updated May 2022. I have also increased my target invested in some holdings which means the percent invested drops i.e. say my target invested in AMD was £10k, now it would be £10.5k, note don't confuse target invested with current value as target invested is actual hard cash invested i.e. book cost.
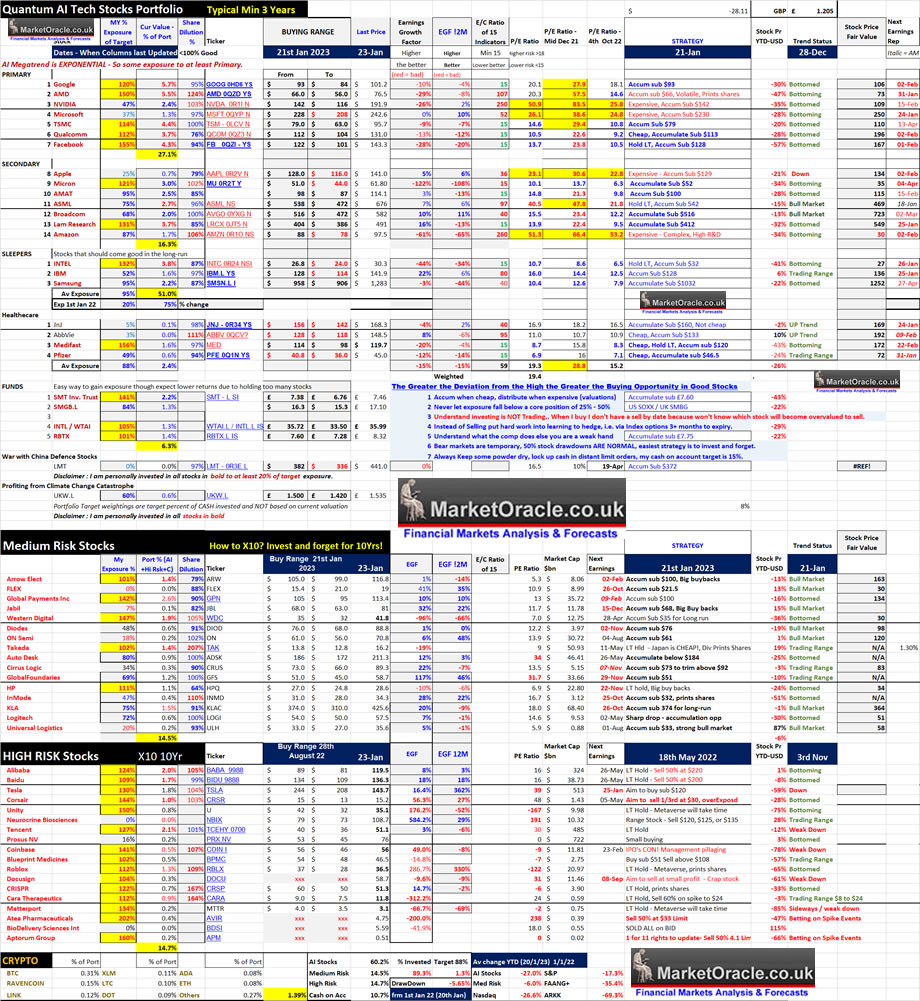
Table Big Image - https://www.marketoracle.co.uk/images/2023/Jan/AI-stocks-23-big.jpg
AI stocks Table explained
The fundamentals for stocks CHANGE to varying degree following each earnings report, hence volatile price action around earnings reports so one needs to keep upto speed on both the direction of travel and changes in the companies fundamentals.
P/E Ratio - The starting point is the the P/E ratio which is calculated by dividing the share price by the sum of the last 4 reported quarterly earnings per share which is readily available, though different sites use GAAP or non GAAP EPS, my preference is for non GAAP. Higher the PE the more expensive a stock, so the simple aim is to buy stocks for as low a PE as possible, but on it's own the PE is very limited.
Buying Range - High probability range for stocks to trade within to accumulate, where what one buys at what level is determined by ones existing exposure i.e. if one has no exposure then one would accumulate towards the top of the range and then scale in should prices continue to decline down towards the bottom of the range.
Earnings Growth Factor (EGF) - Gives an indication of the direction of travel of earnings where the higher the positive percentage the better. Whilst a negative EGF warns of contracting earnings which should command a LOW P/E ratio to justify accumulation. EGF is calculated by dividing share price by latest EPS X4 then divided by current P/E ratio -1 for example (1X4)=4, 100/4 = 25, if current P/E 30, thus 30/25-1 = EGF +20%.
E/C Ratio - A formulae encompassing 15 inputs such as Price to Book, Price to Sales, P/E etc to better determine which stocks are cheap or expensive in relative terms where 15 is the minimum reading.
EGF12M - Similar to the EGF, however instead of the current quarter EPS X4 I am,using my own estimated EPS for the next 12 months to arrive at the EGF12M percent, as an indication of how strongly a stocks earnings could grow over the next 12 months.
Stock Price Fair Value - Based on the current PE ratio divided by the fair value PE ./ Ratio which is usually 18 for most stocks that is adjusted by the 12M EGF. So one wants to buy a stock for as below fair value as possible, whilst buying above the fair value one is over paying to some degree for exposure to a stock. Note it is not a price target but an indicator of how cheap a stock price is compared to future earnings expectations.
MY % Exposure - Is how much I have invested in a stock as percent of the target amount i.e. if my target for a stock is £10k, and I have invested £5k then the exposure is 50%.
Port % (AI +Hi Risk+Cash) - My holding in each stock as a percent of AI stocks + High + Med Risk stocks + Cash on account. So basically my public portfolio.
Share Dilution - the degree to which a company either prints shares (over 100%) or buy backs shares (under 100%). This metric is more important when the EGF is low or negative, i.e. AMD is weak because of negative EGF and high share dilution.
Tuesday 24th January 2023
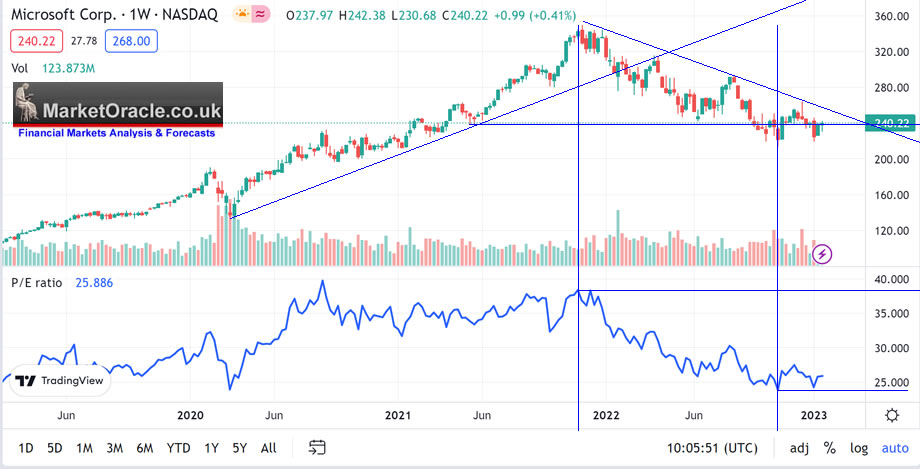
MSFT - $242.6, EGF 0%, EGF12M 10%, PE 26.1, Fair Value 250
GPT Microsoft trading on 26X earnings not cheap when compared to it's Quantum AI tech stock brethren. However it is the cheapest it's been at for many a year having traded down to equal it's pandemic low valuation which also illustrates why many so called analysts waiting for the PRICE to revisit pandemic levels don't have a clue what they are doing. In terms of downside risk Microsoft is shouting that it is reluctant to trade down to $200, so in terms of buying the $228 to $208 range is the best one can expect to accumulate in. The EGF's say it all, 0%, and +10% whilst most are negative, thus is sowing the seeds for a resumption of it's bull market so I expect a positive response to earnings likely to increasing to boost their coffers by capitalising upon GPT3-4-5, that they hope can finally put a dent into the Google search money making machine, though I seriously doubt they will! I am currently 37% invested and will continue to seek opps to increase exposure to this primary AI tech stock.
JNJ - $169 , EGF -4%, EGF12M 2%, PE 17
Briefly JNJ is a slow burn steady as she goes stock, slow earnings growth, boring in fact, still it does pay a dividend and should deliver on earnings expectations, my exposure is just 5% as the stock has never traded down to a level where I would consider buying, there was no panic buying opportunity, unlike in for instance Moderna and to a lesser extent Pfizer, so I hold very little JnJ hence my lack of interest in the stock.
Wednesday 25th January 2023
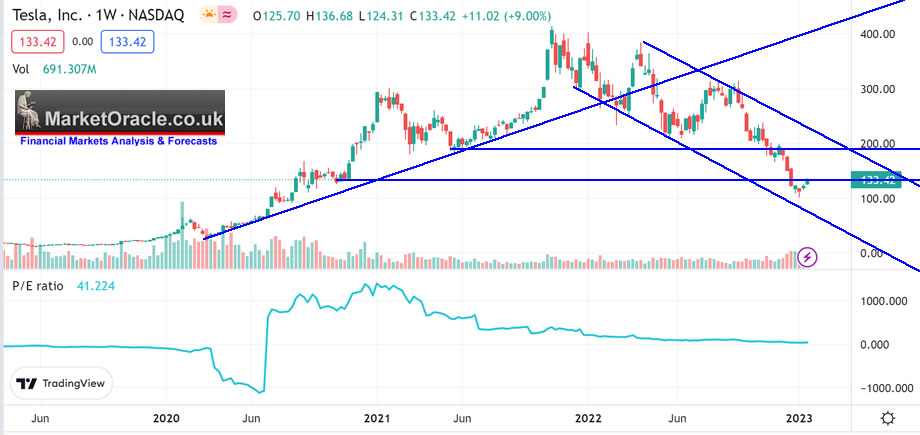
TESLA - $143, EGF 16%, EGF12M 362%, PE 39
Tesla's PE ratio collapsed along with it's stock price to a low of $100 a share! And as expected has rebounded strongly to now well above $130 and should continue trending higher to north of $160, to eventually attempt to break back above $200 this year, but the trend will be volatile i.e. expect huge gap moves. In terms of earnings the EGF's remain strongly positive so Tesla regardless of MSM noise should continue to post positive earnings growth signs for which can be seen in the reopening of China which thus feeds the stock prices trend higher. The valuations has reset to X39 and should continue to moderate during 2023 which suggests to expect earnings to continue to grow all year. After some trimming I am currently 130% invested and I aim to continue to lighten towards being about 115% invested in this volatile AI tech giant.
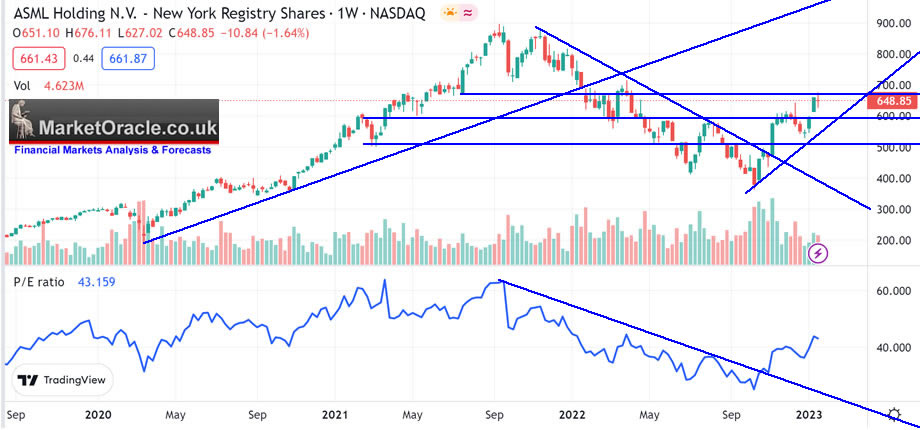
ASML - $676, EGF 7%, EGF12M 6%%, PE 40
They aren't many stocks that can get away with trading on a PE of 40 but ASMAL can, why because they are a literal monopoly that no one else can replicate, produce the EUV machines that the likes of TSMC and Intel use to make the chips. First comes industry demand for the machines that make the chips then retail demand for the chips. The EGF's speak volume for why this stock trades at a hefty premium. ASML:is on a run towards new all time highs during 2023. The bottom line is that ASML will deliver an earnings BEAT.
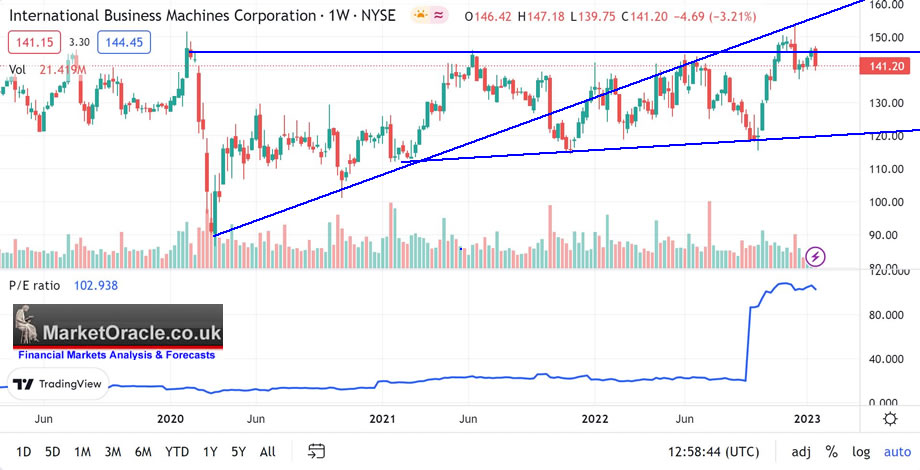
IBM - $142 EGF 22%, EGF12M 6%, PE 16
IBM the sleeping giant was one of the best performing stocks of 2022 and with very strong EGF's has the potential to blast off out of it's multi-year trading range towards $200 a share during 2023! A fair PE of 16 coupled with high EGF's suggest IBM really could surprise all who had written it off as a dead dividend stock, not with EGF scores of +22% and +6%! So whilst the stock price says SELL the dinosaur trading at the top of it's trading range, the fundamentals of the company say higher prices, especially if one understands what's going on under the hood in terms of Quantum Computing, AI and a library of tens of thousands of patents then the picture of IBM of the past that most hold in their mind is not the same as the IBM of today. The bottom line is that IBM is primed for a positive earnings surprise!
LRCX - $491, EGF 16%, EGF12M -13%, PE 13.9
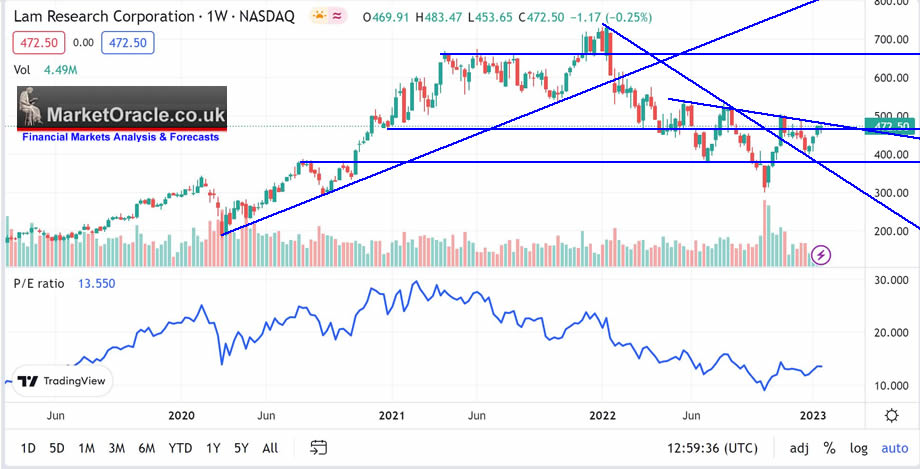
I have to admit to having a soft spot for Lam Research which is why I am 131% invested even after trimming, trades on just X13.9, with a positive EGF of 16%, whilst earnings will contract during 2023 hence 12M EGF of -13%. However forward EGF is more guesstimate so less important than actual EGF which is strongly bullish for the stock price that has soared off it's $300 low, well done to all those who bought any of LRCX near it's low because it's not going to see those levels again anytime soon at best could dip to just below $400 below which lies heavy support, as a prelude to an eventual breakout higher to above $500 that would propel the stock towards it's all time high of $730. The bottom line is that Lam is heading for an earnings beat.
Thursday 26th January 2023
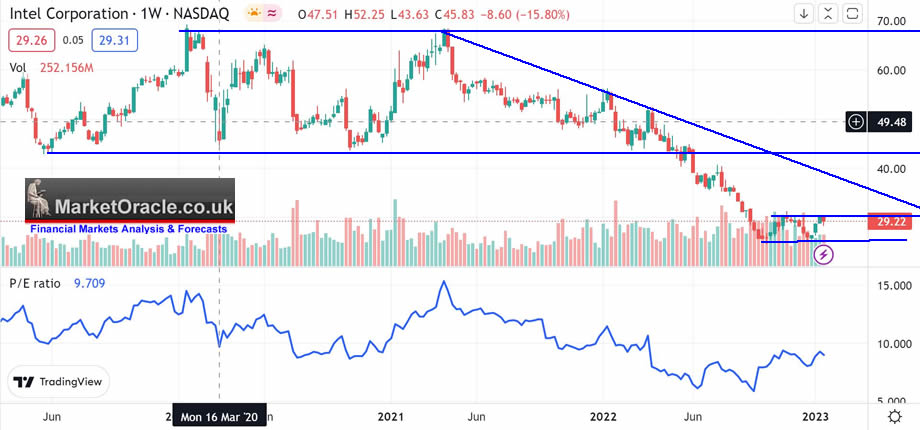
Intel - $30.3 EGF -44%, EGF12M -34%, PE 10.7
If one just looked at the PE then Intel would look cheap, but it's EGF's are horrific which is a function of placing huge bets on new Fab's that will take several years to be built and only then will we know if the bets pay off or not. In terms of Intel's battle against AMD then the spread between the two has narrowed a little but AMD still produces the better chips by some margin that only TSMC can correct for Intel. Intel remains a sleeping giant pending earnings growth, until then the best one can hope for is that it holds the current range in attempts to build a base to recover back above $40. The bottom line is that EGF of -44% and -34% are strongly pointing to another bad earnings report on the upside everyone is now conditioned to expect bad earnings from Intel so the bad news is already baked in which means it would only take a glimmer of hope to fuel a rally in this sleeping tech giant.
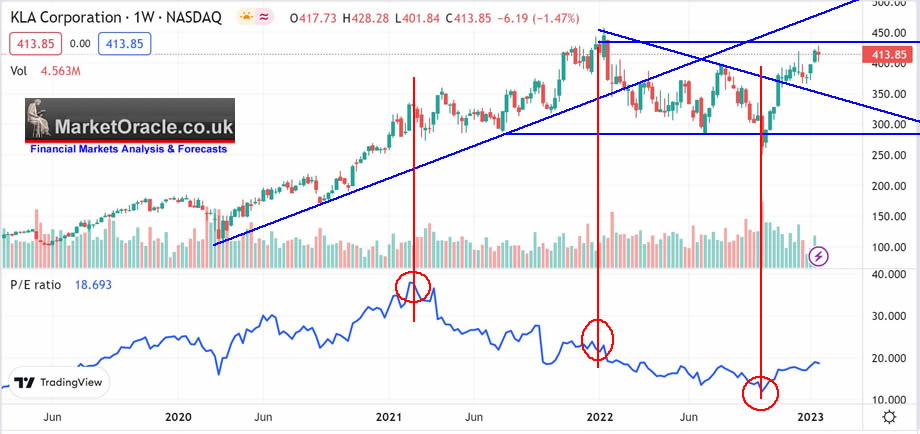
KLAC - $414 EGF 20%, EGF12M -9%, PE 17.5
KLA is on of my favourite higher risk semi stocks that trades on X17.5 on a market cap of $59bn about half that of AMD so not exactly a small cap high risk stock. What sticks out is it's relentless earnings growth as the below chart illustrates. The great bear market gave us two great sub $300 opps to accumulate in a stock that today at $414 carry's a lower valuation then when it was trading at $200 barely 2 years ago! If any of the semi stocks on my list is going to blast off to new all time highs then it is going to be KLA! I trimmed on the rally which brings my exposure down to 75% so I am eager to accumulate on the stocks next dip below $400 in advance NEW ALL TIME HIGHS. EGF of 20% strongly suggests to expect KLA to beat earnings.
Tuesday 31st January 2023
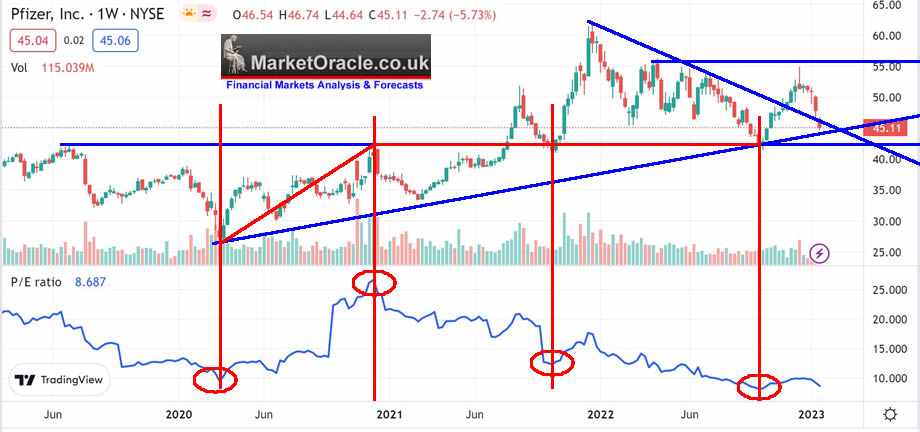
Pfizer - $45, EGF -12%%, EGF12M -4%%, PE 6.9
The Pfizer stock price is precisely where it was trading 2 years ago which ordinarily would be bad news but over that time period the PE has contracted from X25 to just X7, to basically back to the Pandemic low which means the stock is cheap despite negative EGF that suggests to expect contracting earnings, however a PE of 6.9 has a huge amount of margin of safety built into it that even on bad earnings I doubt we would see much of a dip in the stock price, that and pays a 3.6% dividend, thus I continue to seek opportunities to accumulate to increase my exposure from 49% invested as we await the stock to breakout of 2 year trading range.
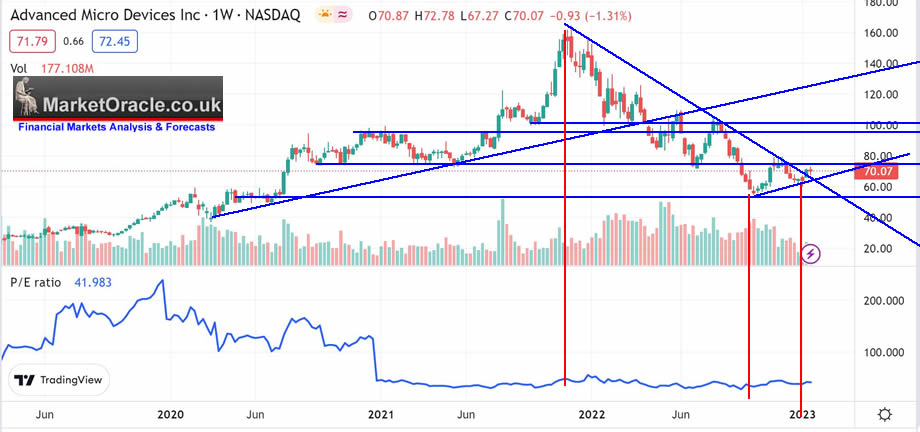
AMD - $76.5, EGF -29%%, EGF12M -8%. PE 20.3
AMD continues to crush Intel in terms of gaining market share by means of utilising TSMC technology against which a stagnating Intel could not compete that had propelled the stock to an eye watering high of $160 only to result in an even more spectacular collapse to $55! In fact when the stock was trading at it's low I posted - "The bottom line is buying AMD today at $55 is akin to buying AMD at it's cheapest valuation EVER! Which is why I am 154% invested!" Today I am still invested to the rafters in AMD at 150%. The stock price has recovered to $76, that is a near 50% advance off it's low that could run to heavy resistance at $100. However EGF's are strongly negative. which means AMD is going to find it tough going at over $80, every dollar gained will be a battle until earnings start to grow once more, so my strategy is to trim north of $80 with a view to accumulating below $70. So for AMD earnings are definitely looking like BUY the rumour and SELL the news.
Wednesday 1st February 2023
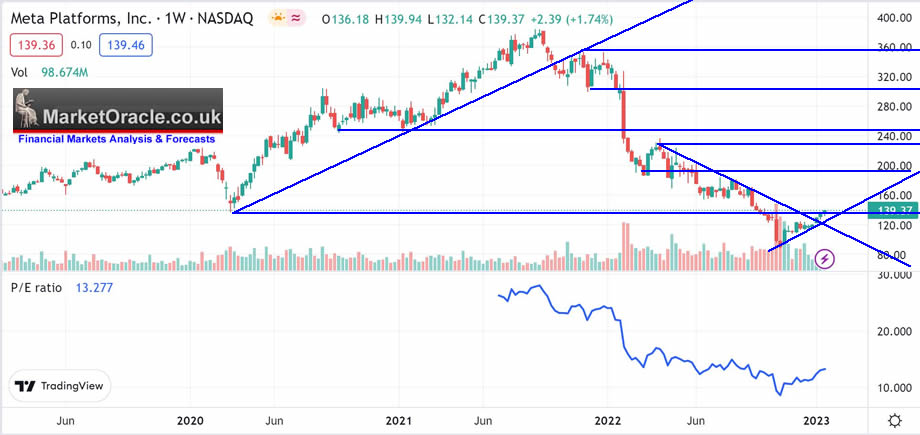
META - $143, EGF -28%, EGF12M -20%. PE 13.7
META is crawling it's way out of the pit of investing HELL after having collapsed to an unimaginably low price of just $89! A collapse that prompted crazy talk amongst the weak hands if they should SELL to buy something else, that is what capitulation looks like! At the start of 2022 the lowest I could imagine META trading to was $140, well it BLEW through that and only now has recovered to be perched just above $140. The investing herd clearly HATE the metaverse even though it IS the FUTURE! With the next big step being the release of Quest 3 later this year. Meta awaits it's killer app's which will be centered around running simulations of the real world as I covered recently.
Whilst the stock price has rallied, however EGF's don't paint a positive picture and thus META is a strong candidate for buy the rumour sell the news. The stock is in a weak uptrend that could continue to $160, then most probable is that it will revisit sub $120, though unlikely to trade as low as $100 as the world awaits earnings growth. Though any glimmer of hope in earnings will send META soaring to $160, so META remains in a very volatile state as earnings are likely to be weak.
Thursday 2nd February 2023
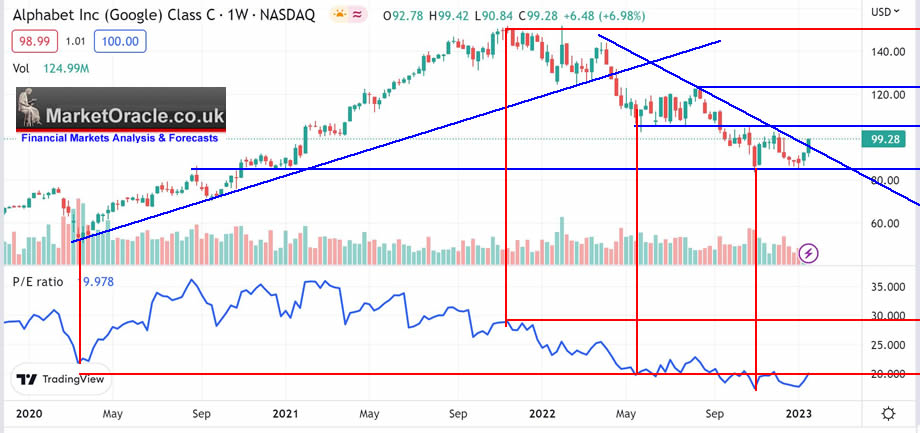
GOOGLE - $101, EGF -10%, EGF12M -4%. PE 20.
Google declares WAR on Microsoft GPT as founders Larry and Sergey return to lead more than 20 AI projects some of which you will have heard of, many that will be revealed over the coming months. The problem with Google is that the current CEO is a bit of a *****, a manager rather than a visionary, not aggressive enough, not when one looks at Elon Musk and Mark Zuckerberg, hence the founders have come back to get Google back on track to turn it into the ruthless Sky net that we all love, to crush the competition so as to ensure that Google remains the primary AI company on the planet. The bottom line is that Google already has everything to out compete GPT and anything else Microsoft is cooking in attempts to out search Google Search.
Google over the long run is a money making machine which results in a contracting P/E ratio over time. For instance today's valuation at $101 is the same as at the pandemic low when the stock price was $60, achieved with relatively light stock buyback's which is why Google remains numero uno on my list, the safest stock on the planet for the long-run. The stock price is attempting to base ahead of beginning it's bull market proper by targeting a break above $120. Given that EGF's are negative most probable is that Google remains range bound for sometime i.e. between $118 and $84, though I don't see Google breaking to new bear market low. I am 120% invested in Google and will continue accumulate near the lows and trim near the highs of it's range pending a resumption of it's bull market..
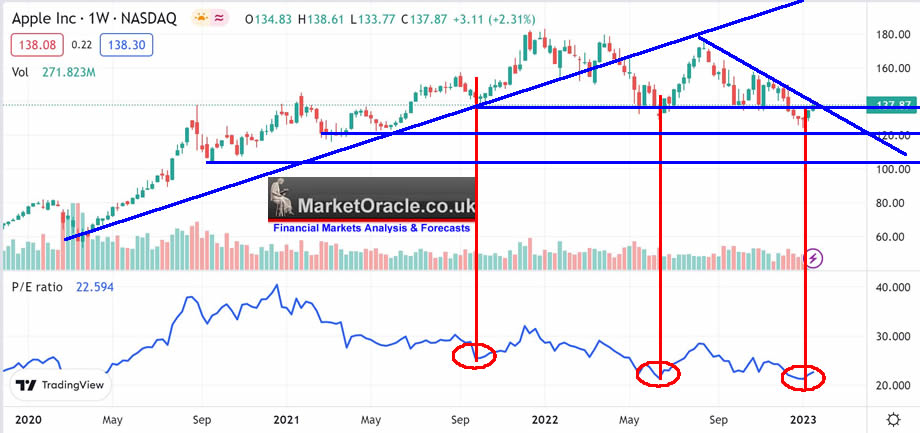
APPLE - 141 EGF 5%, ,EGF12M 6%. PE 23.1
The Apple stock is weak, targeting the bottom of it's current range at $120, which if breached would then target around $106. However as the graph illustrates that whilst Apple is not cheap at X23.1, the fact that Apple is engaged in huge buy backs as illustrated by Share dilution at 80% shows that the stock gets cheaper over time even if the stock price goes nowhere, and hence acts as support under the stock price. Apple has positive EGF's courtesy of the buy backs so the stock price whilst weak is unlikely to experience a waterfall moment, instead most probable is that the stock price will continue to trade within a range for some time. I am currently 25% invested and will continue to accumulate Apple on fresh lows, i.e. sub $120, and maybe some light buying sub $128. The bottom line is that if there is one stock that could trade at NEW bear market lows then that stock is Apple.
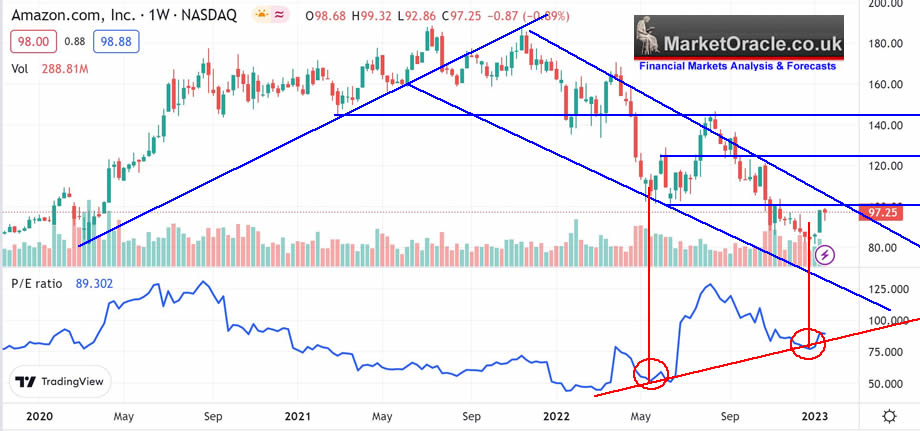
AMAZON - $97.5, EGF -61%, EGF12M -65%, PE 51
Another FAANG stock that retail investors obsess over. The problem with Amazon is that it has never been cheap! That has always been at risk of a valuation reset hence it's recent dissent into the pit of investing hell for all those who failed to read the writing only recently bottoming out at $81. If you look at the charts then you will see that Amazon is to date the only one that has become MORE EXPENSIVE as the stock price has fallen! This is a function of PRINTING SHARES coupled with Amazon being Bezos' personal piggy bank to extract funds from for his boyz toyz. The stock price has bounced to resistance so I don't see much upside. Amazon is definitely not one stock to get carried away with accumulating, I am not seeing a way for this stock to get anywhere near it's all time highs for many years!
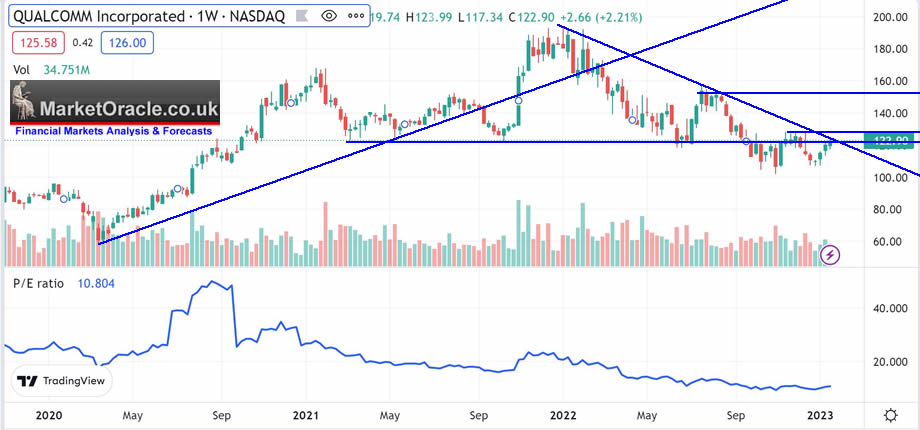
QUALCOM - $131, EGF -13%, EGF12M -12%. PE 10.5
And last but not least is Qualcom - Qualcom has a finger in so many pies, will power META's Quest 3 headsets and beyond and for all that it trades on multiple of just 10.5, bouncing off a low of $107. EGF's are negative so I don't expect positive earnings, though in the plus side pays a 2.5% dividend. Qualcom is comparable to AMD though at near half the valuation. The stock just cleared resistance which means it could be propelled higher to $150, a rally that I would embrace to trim on. I am 112% invested and don't fret about it's long-term prospects, it will come good in the long-run regardless of any gyrations over the coming months, a good stock to accumulate on the dips.
This article Stock Market Rally Slams into Q4 Earnings Season was first made available to patrons who support my work.So for immediate first access to ALL of my analysis and trend forecasts, including new near daily market briefs then do consider becoming a Patron by supporting my work for just $5 per month. https://www.patreon.com/Nadeem_Walayat.
For first access to ahead of the curve analysis as my extensive analysis of the stock market illustrates (Stocks Bear Market Max PAIN - Trend Forecast Analysis to Dec 2023 - Part1), that continues on in the comments section of each posted article, all for just 5 bucks per month which is nothing, if you can't afford 5 bucks for month then what you doing reading this article, 5 bucks is nothing, if someone did what I am doing then I would gladly pay 5 bucks for it! Signup for 1 month for a taste of the depth of analysis that cannot be beat by those charging $100+ per month! I am too cheap! I am keeping my analysis accessible to all, those willing to learn because where investing is concerned the sooner one gets going the better as portfolios compound over time, $5 month is nothing for what you get access to so at least give it a try, read the comments, see the depth of analysis, you won't be sorry because i do do my best by my patrons, go the extra mile.

And gain access to the following most recent analysis -
- Stock Market Counting Down to Pump and Dump US CPI LIE Inflation Data Release
- Stock Market Completes Phase Transition, US Real Estate Stocks - Housing Market Part1
- Stock Market Rally Slams into Q4 Earnings Season
- Stock Market Gasping to Reach 4000 Ahead of Earnings Season, Dow New All Time High 2023?
- S&P500, Gold, Silver and Crypto's Trend Forecasts 2023
- Stocks Analysis Bonanza - GOOG, QCOM, ASML, TCHEY, BABA, BIDU, TSLA, WDC, RBLX, MGNI, COIN, BITCOIN CAPITULATION!
- Stocks Bear Market Max PAIN - Trend Forecast Analysis to Dec 2023 - Part1
- Stock Market Analysis and Trend Forecast Oct 2022 to Dec 2023 - Part 2
So for immediate first access to to all of my analysis and trend forecasts then do consider becoming a Patron by supporting my work for just $5 per month. https://www.patreon.com/Nadeem_Walayat.
My Main Analysis Schedule:
- US House Prices Trend Forecast - 50%
- Global Housing / Investing Markets - 50%
- US Dollar / British Pound Trend Forecasts - 0%
- High Risk Stocks Update - Health / Biotech Focus - 0%
- State of the Crypto Markets
- Gold and Silver Analysis - 0%
- How to Get Rich - 75%

And ensure you are subscribed to my ALWAYS FREE newsletter for my next in-depth analysis.
Your selling the rumour to buy the next dip 89% invested analyst.
By Nadeem Walayat
Copyright © 2005-2023 Marketoracle.co.uk (Market Oracle Ltd). All rights reserved.
Nadeem Walayat has over 30 years experience of trading derivatives, portfolio management and analysing the financial markets, including one of few who both anticipated and Beat the 1987 Crash. Nadeem's forward looking analysis focuses on UK inflation, economy, interest rates and housing market. He is the author of five ebook's in the The Inflation Mega-Trend and Stocks Stealth Bull Market series that can be downloaded for Free.
 Nadeem is the Editor of The Market Oracle, a FREE Daily Financial Markets Analysis & Forecasting online publication that presents in-depth analysis from over 1000 experienced analysts on a range of views of the probable direction of the financial markets, thus enabling our readers to arrive at an informed opinion on future market direction. http://www.marketoracle.co.uk
Disclaimer: The above is a matter of opinion provided for general information purposes only and is not intended as investment advice. Information and analysis above are derived from sources and utilising methods believed to be reliable, but we cannot accept responsibility for any trading losses you may incur as a result of this analysis. Individuals should consult with their personal financial advisors before engaging in any trading activities.
Nadeem Walayat Archive |
© 2005-2022 http://www.MarketOracle.co.uk - The Market Oracle is a FREE Daily Financial Markets Analysis & Forecasting online publication.


