


Stock Market Counting Down to Pump and Dump US CPI LIE Inflation Data Release
Stock-Markets / Financial Markets 2023 Apr 03, 2023 - 06:17 PM GMTBy: Nadeem_Walayat

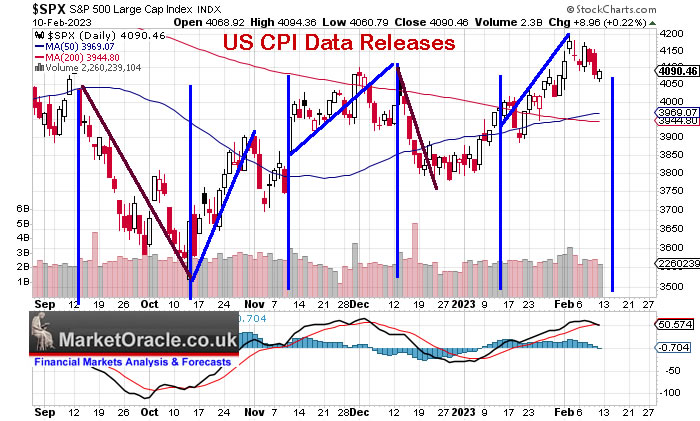
US CPI Data released for October, November, December and January show the CPLIE script of usually a fake out drop ahead or on release followed by strong rally on relief that whatever the data is, it was not quite as bad as it could have been and thus triggers a FOMO rally fed by bears shorting during the preceding decline rushing to cover their shorts, and so are we in for a similar event Tuesday? or is this time going to be more like December, the only time when there was a deviation from the script as it was looking rather obvious by then and hence the market did the opposite, what is obvious right now? Probably a FOIMO rally, so on face value suggests to expect the opposite which is what I have been positioning towards these past weeks.
This analysis Stock Market Counting Down to Pump and Dump US CPI LIE Inflation Data Release was first made available to patrons who support my work.So for immediate first access to ALL of my analysis and trend forecasts then do consider becoming a Patron by supporting my work for just $5 per month. https://www.patreon.com/Nadeem_Walayat.
And gain access to the following most recent analysis and regular market briefs -
THE INFLATION MEGA-TREND
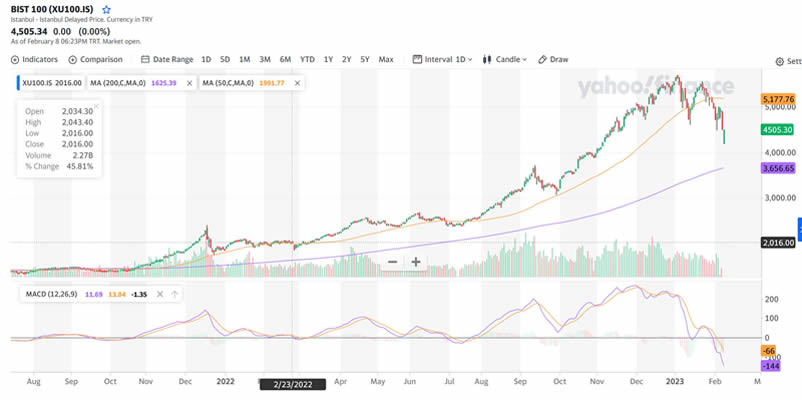
The primary driver for stock prices is Not Innovation, Disruption or even GDP growth (though it is part of the soup), No the Primary driver for stock prices is INFLATION! It's why Turkish stocks (before this weeks killer Quake) were racing ahead despite persistently high Turkish inflation rates of as much as 85% during 2022 as they experienced their own version of the Crack up BOOM!
INFLATION! That the politicians and their central bank minions have convinced the masses is good, inflation is necessary for the lifeblood of the economy instead Inflation ensures that Wage slaves will get poorer all whilst the rich get Richer, they don't have to do anything just have the governments and central banks keep printing money whilst they are invested in assets as they watch inflation do it's compounding magic!
This is the smoke and mirrors inflation graph that gets peddled out each month that the governments and central banks want people to focus on.
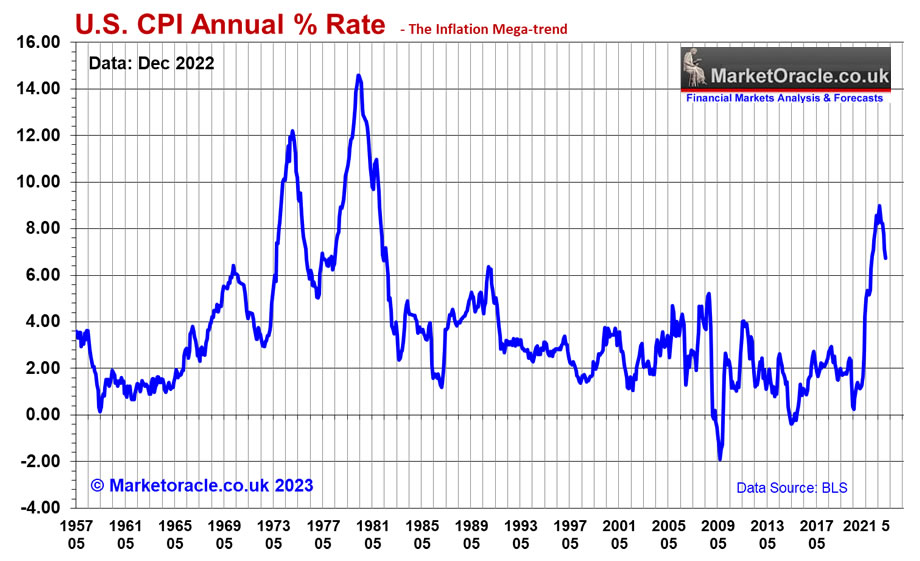
Is the inflation pain over!
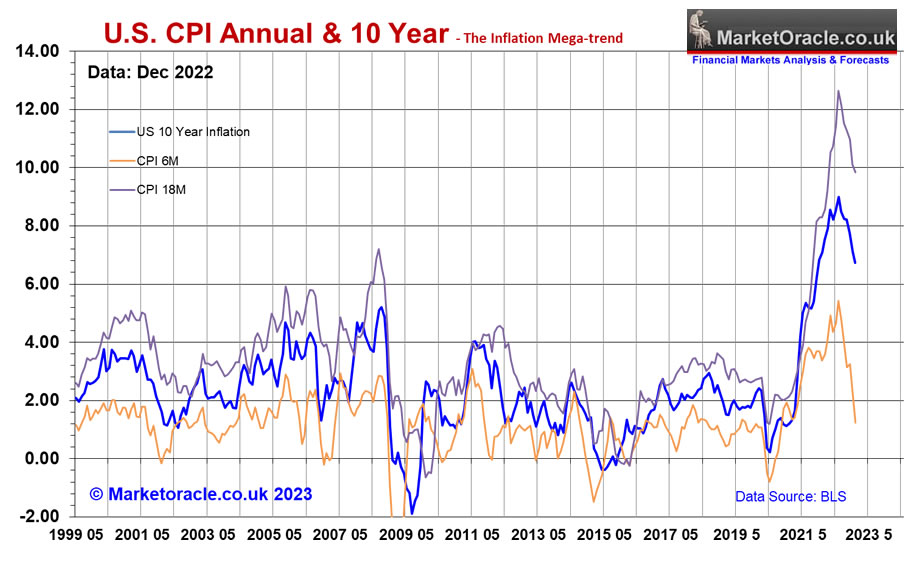
Not so fast! The 10 year inflation graph shows why the inflation pain is only just beginning! And this is before we consider the fact that they have fiddled the inflation indices to such an extent that it probably under reports REAL inflation by 50%! Take CPILIE and double it and that is the real inflation rate!
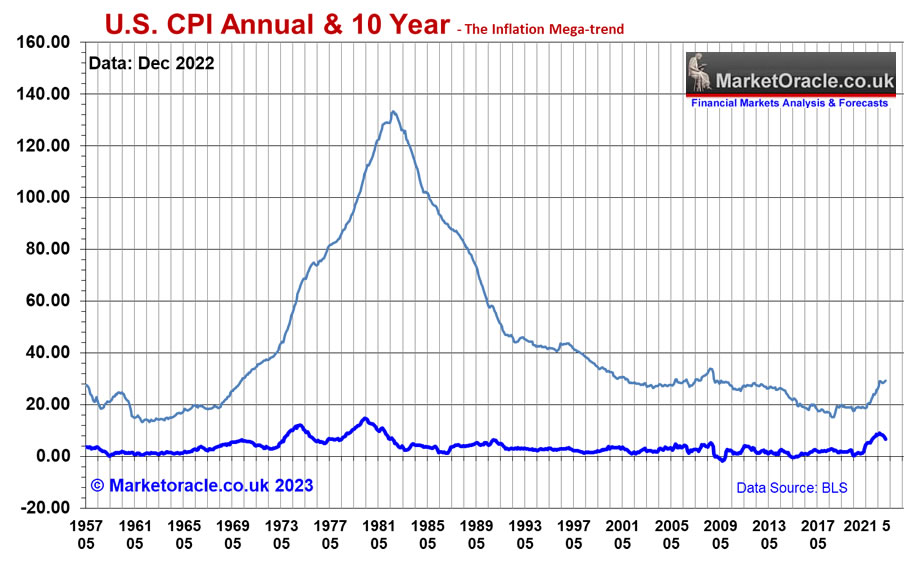
Imagine what this graph now looks like when allowing for REAL inflation and then you have an inkling of the PAIN that the masses are experiencing which is NOT going to lessen even if CPI LIE falls to below 3% which I doubt it will. but nevertheless it won't make any difference as the 1 year inflation rate climbs higher and with it will the compounding PAIN that every worker will experience as I warned over a year ago that Western economies are marching to civil unrest where strikes turn to ,mass protests which turn into civil unrest due to the building stress of increasing inflation pain all whilst the con merchants in the central banks peddle the line that inflation is falling, Instead the mass of workers feel the pain of RISING PRICES and other STEALTH INFLATION, such as cutting PENSIONs on either the growth front or payment front in REAL TERMS. Peoples incomes are being squeezed all whilst governments paints the false narrative of Inflation being back under control when the truth is the exact opposite which will push the masses towards revolt where the prime time for such events are the hot summer months. We are likely to see spikes in civil unrest take place every summer across the western world that ultimately could even bring governments down!
Virtually every year the UK government chips away at Britains pensions such as the recent announcements to FREEZE the lifetime pension allowance when inflation is running rampant! That is at least a 15% STEALTH TAX RISE! And now their are the likes of the Resolution Foundation peddling the narrative of capping ISA's to a total of £100k because poor people don't save much in ISA's and thus the cap would raise a lot of taxes this despite the fact that the Resolution Foundation themselves are dodging tax by registering their 'thick tank' as a charity so they can AVOID PAYING TAXES! What does shuffling paper in offices have to do with helping the poor and needy? Have they ever directly helped a single poor person in need? I doubt it!
And it's a lot worse than that! because the state pensions for most nations are giant PONZI SCHEMEs! US, UK, France. Italy, Germany, virtually all nations state pensions are ponzi schemes where today's workers pay for today's pensioners, there is NO PENSION FUND! Eventually the ever widening gap between workers contributions vs retiree pension payments is filled by printing money resulting in INFLATION, that governments are panicking to try and reign in prompting demonstrations as are taking place in France right now where the likes of Covid is being seen by some in power as a means of cutting pension liabilities given that across Europe there are now several million fewer pensioners than there would have been without covid, though a pinprick to the pensioner cull that they would be content to experience.
This is why stocks bear markets are TEMPORARY because Inflation os PERMANENT and EXPONENTIAL!
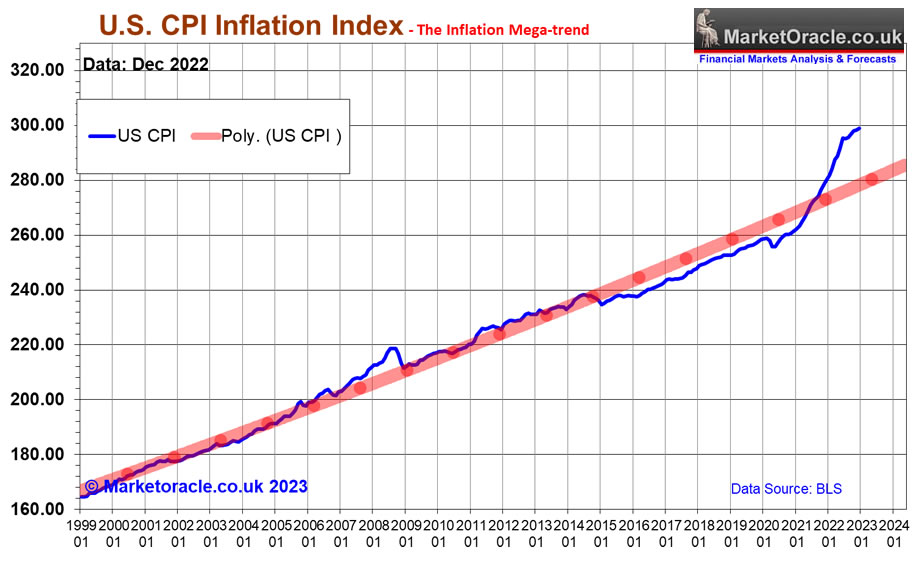
Back to what is going to happen this week to CPLIE and how it will impact the stock market. Well the monthly data shows that we can continue to expect falling CPI inflation on the annual inflation index i.e. Jan CPU Index 2022 was 282.6, vs 280.9 that's 0.6% leaving the indices, and there will be a marginally greater departure for Feb data (released March) of 0.7%. with the big departure of 1% coming for March data released in April that times well for a rally into May because after that Inflation falls are going to stall and could even tick higher during April (May release). So Inflation should continue to provide upside momentum for the next 3 releases than it's going to get tough especially if the Labour market remains strong as Fridays data illustrates.
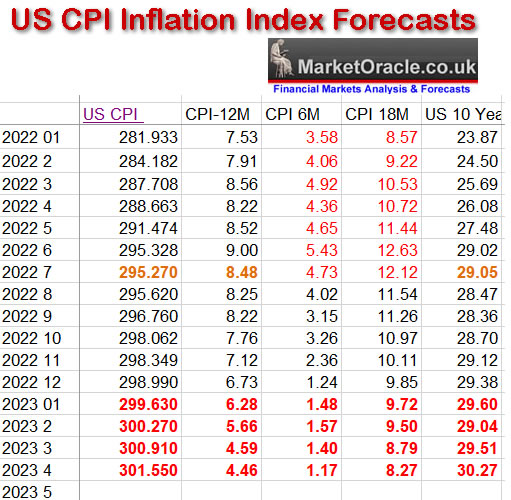
Looking at the inflation spectrum where despite the 12 month continuing to trend lower the 6 month rate has already bottomed and is expected to turn higher for January data, however for the Fed to get to it's 2% target the 6 month rate would need to go negative which is not happening, in fact it's basing above 1% which implies annual CP LIE is going to find it difficult to nudge below 4% even on a temporary basis let alone achieve 2% in 2 years time. Meanwhile the 10 year shows Inflation pain is going to continue to climb higher to above 30%, that is REAL PAIN that people will experience which is NOT reflected in the annual rate, to get a taste of what this means imagine if the annual rate instead of falling to under 5% rose to over 9%. INFLATION PAIN that is invisible in the statistics that the clown economists focus upon. but it WILL have REAL WORLD consequences!
The bottom line is that regardless of what the CPLIE annual rate does over the next 3 months (declines expected). real inflation pain is NOT diminishing but instead INCREASING and thus implies that those banking on Fed rate cuts anytime soon, the so called Fed pivot are gong to be disappointed, instead post the current 3 month window annual inflation could start creeping higher and so we could so higher Fed rates being priced in to well above 5%, maybe even 6%.
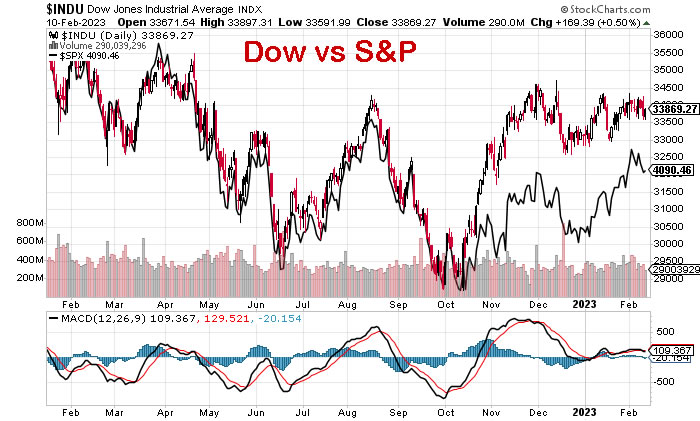
Current State of the Bull Market
The Dow closed Friday at 33,869 as the Dow continues to show a strong positive deviation against the forecast that confirms 2023 should turn out to be an epic year for stocks.
- Stocks Bear Market Max PAIN - Trend Forecast Analysis to Dec 2023 - Part1
- Stock Market Analysis and Trend Forecast Oct 2022 to Dec 2023
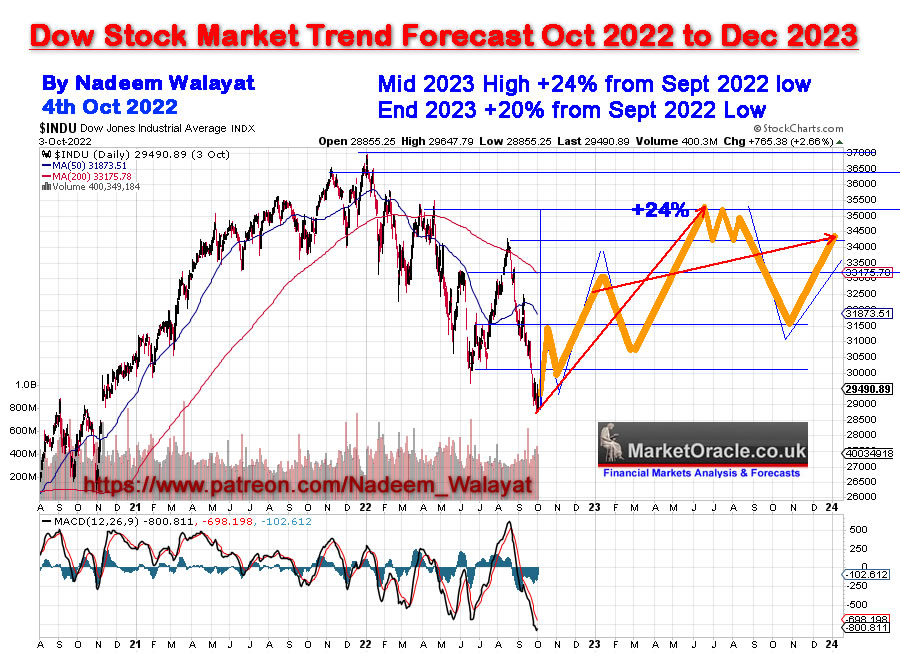
Stocks Bull Market milestones SINCE my forecast road map was posted early October -
1. Higher high above 34,300 - check
2. 50day SMA cross above 200 day - Golden cross
3. Santa rally - check
4. Up first 5 days of January - check
5. January Up Close - Check
6. Higher low - pending.
7. 200 Day SMA Turning UP - Pending
8. .....
So the Dow so far continues to confirm my trend forecast that expects the pre-election year of the Presidential cycle to deliver a strong bull run which given the positive deviation could even see the Dow trade to a new all time high later this year!
S&P Bull Market MIlestones
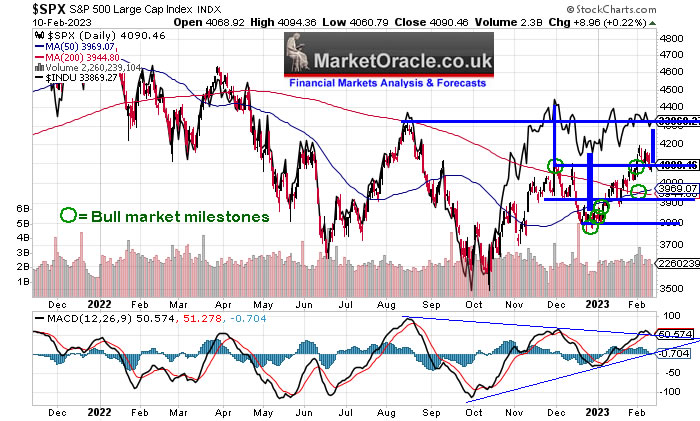
(Charts courtesy of stockcharts.com)
1. Higher high above 4100 - check
2. Santa rally - check
3. Up first 5 days of January - check
4. January Up Close - Check
5. 50day SMA cross above 200 day - Golden Cross - check
6. Higher Major Low - Check 3765
7. 200 Day SMA Turning UP - Pending
As expected the S&P has vastly out performed the Dow over the past month given Dow's earlier over performance since which the Dow has stagnated, as over the long-run the S&P should outperform the Dow. The S&P now stands at 6 bull market check marks vs the Dow on 5. This trend is likely to persist as the S&P continues to play catchup.
Stock Market
S&P 4090 - Nothing much has changed since my last update, the S&P continues to check the check boxes for this correction, Thursday saw a lower high on break below 4080. targeting 4000. Daily triggered a minor sell but so far nothing significant which means that this correction is still finally balanced between dropping a couple of hundred more S&P points or FOMO to above 4300 until the daily gets weaker i.e. the daily MACD is on the verge of giving a cross over signal as the market is priming itself going into CPI to trigger a move in either direction.
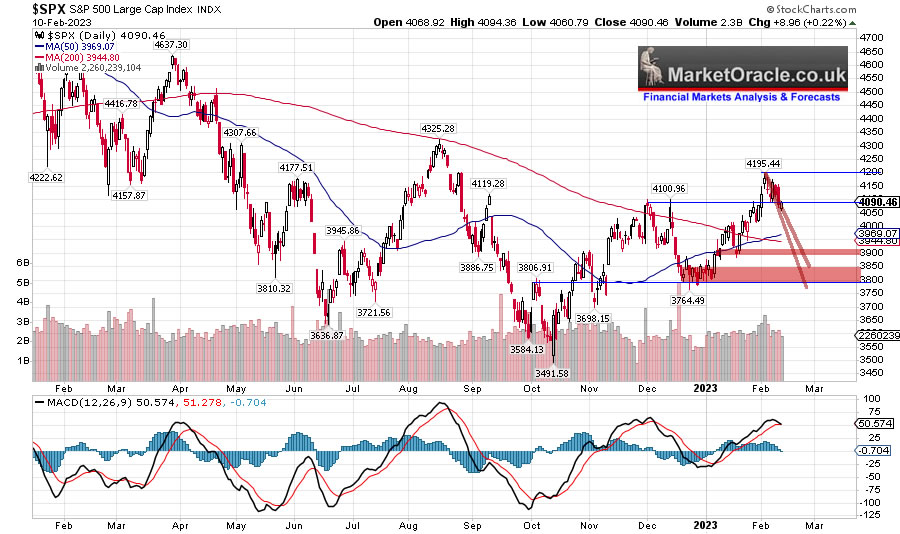
However, my expectations remain for a DOWN Feb, January ended at at 4070 thus I expect the S&P to end the month below 4070, probably by some margin. The direction of travel should be lower to first target 4000 and then 3900 with a chance of overshoot down to 3800 still possible.
My plan is to start scaling out of my PUT options at 4000 with the last one held for below 3900.
In terms of buying, it all depends on what individual stocks do, for instance TESLA, I'd want to see sub $158 to start accumulating. Nvidia sub $168, so I will only accumulate those that trade at deep discounts to recent highs as well as continue accumulating exposure to US housing stocks.
The bottom line is that both the bulls and the bears have got caught with their pants down. Bulls FOMO-ing at the mouth, only need to look at Nvidia at $223 or Tesla at $207, and the bears thrown out of their short positions seeking to regroup to short north of 4200. So the market is primed for a DROP down to at least 3900 with tech stocks leading the decline just as they led the rally.
Also given that we are in a correction then this suggests market reaction to Tuesdays CPI will be negative so implies that the CPI will be worse than the market is expecting, The best price action would be for a rally into and just after the release of CPI so as to Prime the PUMP before the DUMP sell off as the market has run well ahead of itself into a mini FOMO so is primed for a sell off that has already begun given where we stand some 100 points off the 4195 high. A PUMP then the DUMP!
CI18 Crash ./ Bear Trigger
Briefly, as per Patron request CI18 calc's to 37% today (100% = On) so the expectations of a new bear market or a crash are not visible either to this "Early Warning Siren" or myself, not over the next few weeks at least.
AI Stocks Portfolio
Portfolio - Current state 83.4% invested, plenty of cash to Buy the DIP and room for a little more trimming should CPI trigger a FOMO rip your face off rally. I have added US housing stocks mini portfolio that total 2.2%.
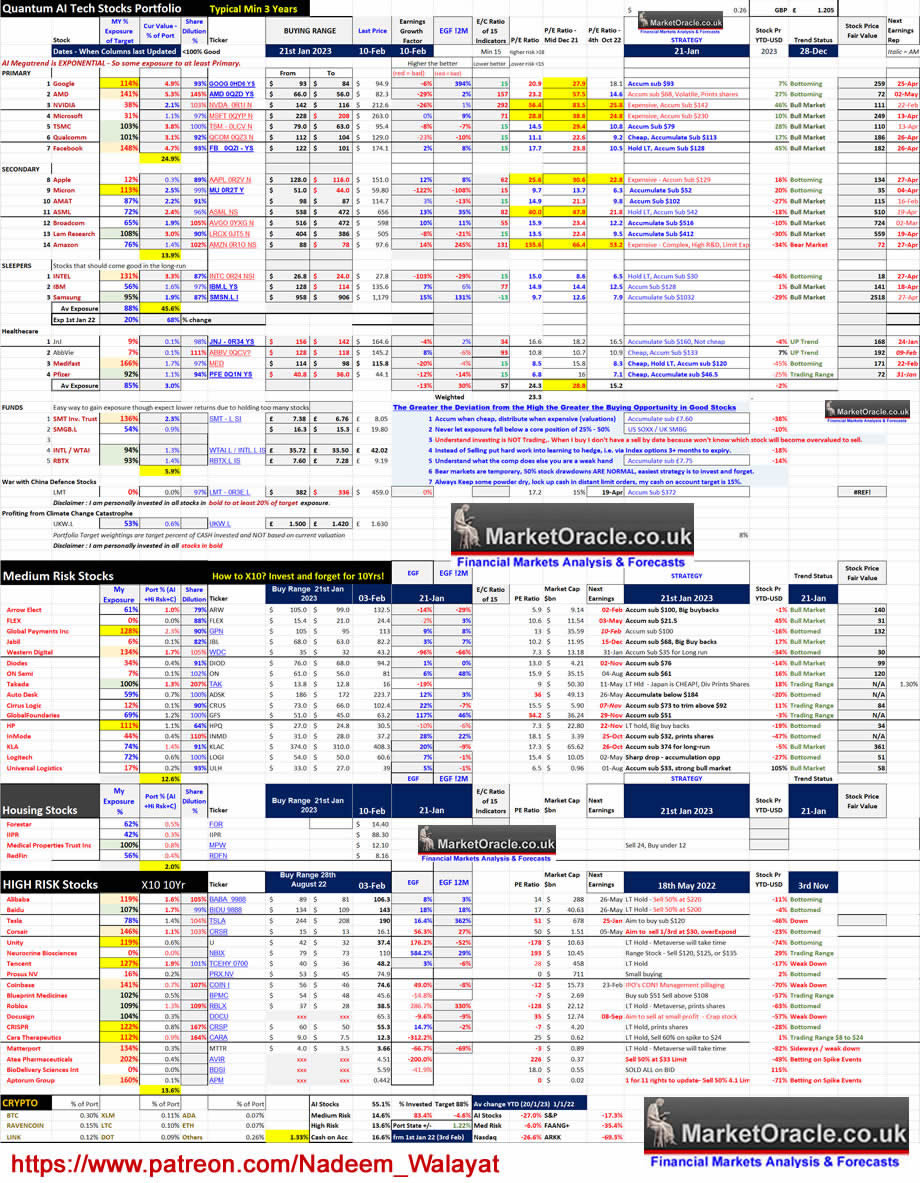
(see previous article for table key). Table Big Image - https://www.marketoracle.co.uk/images/2023/Feb/AI-stocks--10.jpg
BIG PICTURE - We are in a BULL MARKET! In fact of the Top 17 stocks, 9 are in BULL Markets. Those that are not -
Google - Bottoming - Plunges on BARD fail.
AMD - Bottoming - A great AI stock that Prints too many shares, hence stock price is not doing a Nvidia or META.
Apple - Bottoming - Over valued but buy backs act as EPS support.
Micron - Bottoming
Amazon - Bear Market - Deceptive EGF, the PE is RISING as the stock price falls, that's what BAD stocks do. Sometimes stocks like Amazon can break formulae's such as EGF, I have coloured it's EGF in red to make it clearer.
Intel - Bottoming - Been in far worse state in the past, late 1980's come to mind.
So whilst stocks are undergoing a correction (approx 1/3rd done), the big picture is that of a BULL market.
Which stock currently calc's as the best in my AI list?
Crunching the numbers, the best stock right now is META! The worm has finally turned! Becareful of over trimming META! I expect META to surprise to the UPSIDE, X2 even to a NEW ALL TIME HIGH! Would make a great Christmas present for 2023!
Google vs Microsoft GPT Debate
Microsoft soared on GPT integration whilst Google sank like a stone on BARD dud presentation prompting many to question whether the Google Gravy Train has derailed, destined to rust on the side of the tracks as the GPT Microsoft speeds past.
What do I use?
GOOGLE
*Android - Free
*GMAIL - Free
*SEARCH - Free
*Youtube - Free
*Chrome - Free
*Maps / Earth - Free
*Drive - Paid
*TensorFlow - Free
MICROSOFT
* Windows - Paid
* Office - Paid
I'll be buying the Google DIP!
Briefly - UK fiddling GDP stats to avoid recession Q3 -0.3%. Q4 0%. Q1 2023 -1%? Q2 2023 0%?
This analysis Stock Market Counting Down to Pump and Dump US CPI LIE Inflation Data Release was first made available to patrons who support my work.So for immediate first access to ALL of my analysis and trend forecasts then do consider becoming a Patron by supporting my work for just $5 per month. https://www.patreon.com/Nadeem_Walayat.
For first access to ahead of the curve analysis as my extensive analysis of the stock market illustrates (Stocks Bear Market Max PAIN - Trend Forecast Analysis to Dec 2023 - Part1), that continues on in the comments section of each posted article, all for just 5 bucks per month which is nothing, if you can't afford 5 bucks for month then what you doing reading this article, 5 bucks is nothing, if someone did what I am doing then I would gladly pay 5 bucks for it! Signup for 1 month for a taste of the depth of analysis that cannot be beat by those charging $100+ per month! I am too cheap! I am keeping my analysis accessible to all, those willing to learn because where investing is concerned the sooner one gets going the better as portfolios compound over time, $5 month is nothing for what you get access to so at least give it a try, read the comments, see the depth of analysis, you won't be sorry because i do do my best by my patrons, go the extra mile.
And gain access to the following most recent analysis -
- SVB Collapse Buying Opportunity Counting Down to Resumption of Stocks Bull Market
- Stock Market Counting Down to Pump and Dump US CPI LIE Inflation Data Release
- Stock Market Completes Phase Transition, US Real Estate Stocks - Housing Market Part1
- S&P500, Gold, Silver and Crypto's Trend Forecasts 2023
- Stocks Bear Market Max PAIN - Trend Forecast Analysis to Dec 2023 - Part1
- Stock Market Analysis and Trend Forecast Oct 2022 to Dec 2023 - Part 2
So for immediate first access to to all of my analysis and trend forecasts then do consider becoming a Patron by supporting my work for just $5 per month. https://www.patreon.com/Nadeem_Walayat.
My Main Analysis Schedule:
- How to Get Rich - 85%

- US House Prices Trend Forecast - 50%
- Global Housing / Investing Markets - 50%
- US Dollar / British Pound Trend Forecasts
- High Risk Stocks Update - Health / Biotech Focus
- State of the Crypto Markets
- Gold and Silver Analysis
- And ensure you are subscribed to my ALWAYS FREE newsletter for my next in-depth analysis.
Your ready to trim the rally analyst.
By Nadeem Walayat
Copyright © 2005-2023 Marketoracle.co.uk (Market Oracle Ltd). All rights reserved.
Nadeem Walayat has over 30 years experience of trading derivatives, portfolio management and analysing the financial markets, including one of few who both anticipated and Beat the 1987 Crash. Nadeem's forward looking analysis focuses on UK inflation, economy, interest rates and housing market. He is the author of five ebook's in the The Inflation Mega-Trend and Stocks Stealth Bull Market series that can be downloaded for Free.


 Nadeem is the Editor of The Market Oracle, a FREE Daily Financial Markets Analysis & Forecasting online publication that presents in-depth analysis from over 1000 experienced analysts on a range of views of the probable direction of the financial markets, thus enabling our readers to arrive at an informed opinion on future market direction. http://www.marketoracle.co.uk
Disclaimer: The above is a matter of opinion provided for general information purposes only and is not intended as investment advice. Information and analysis above are derived from sources and utilising methods believed to be reliable, but we cannot accept responsibility for any trading losses you may incur as a result of this analysis. Individuals should consult with their personal financial advisors before engaging in any trading activities.
Nadeem Walayat Archive |
© 2005-2022 http://www.MarketOracle.co.uk - The Market Oracle is a FREE Daily Financial Markets Analysis & Forecasting online publication.