Stock Market Sentiment Speaks: This Is My Strong Warning To You
Stock-Markets / Stock Markets 2024 Nov 21, 2024 - 03:42 AM GMTBy: Avi_Gilburt
As the market has now struck the upper end of my long-term target set many years ago, it seems many have embraced this bull market, to the extent that they see no reason for it to end. However, that is usually the time one has to pay attention for the potential for it to come an end.
The last 25 years have only reinforced the common perspective that the market “always comes back.” Whether we are speaking about the manner in which investors have been trained in a Pavlovian fashion to believe in the omnipotent power of the Fed or whether we are speaking about the manner in which the market has always come back stronger after each larger drop seen over the last 25 years, there is one thing that has become a certainty in the market: Buy and hold is the ONLY way to go.
In fact, I recently read a bullish article which reinforced this perspective, to which I saw the following two comments – which seem to personify the common feelings of the investor community:
“Over (rolling) 30 year investment periods since 1986,, it has paid to be a bull, dollar cost average into a simple equities portfolio”
“I think most people who are chasing stocks forget that. We all have different risk tolerances, but "buy and hold" IMO should fit everyone. There's no reason to not have $VOO or $QQQ as a mainstay in your portfolio. And ignore the temptation to get in and out of the market. Time in the market far outweighs trying to time the market.”
When the general investor community is convinced that “there is no reason to get out of the market at any time,” it tells me we are likely approaching a major topping point, which actually aligns with my general technical analysis work.
As I have written many times before, when you break down the market to its simplest terms, a bull market ends when investors are tapped out of investable money (bullish sentiment reaches an extreme), and a bear market ends when we have reached a selling climax and selling has exhausted itself out (bearish sentiment reaches an extreme).
So, of course, the question is if we are reaching an upside extreme.
From an Elliott Wave perspective, and as I have outlined in several prior articles, we are coming to the conclusion of a multi-decade bull market, and are completing a final 5th wave of a long-term 5-wave structure which initially began in 1933 at the conclusion of the 1929 market crash. For those of you that are relatively proficient in math, you may realize that we are almost at the point of a 100-year long bull market off that low.
Many years ago, I outlined my view that the Fed is creating a Pavlovian response in investors wherein investors assume that a reduction in rates by the Fed will “cause” a rally in the market. This has been the general investor perspective over the last 15 years since the bottom struck in 2009. However, as I have also outlined in prior articles, this perspective is yet another fallacy propagated throughout the investor community.
You see, in years prior to 2009, we have seen the Fed lower rates during market declines with no resulting turn in the market. For those that know their market history, as an example, you would know that the Fed began a rate reduction path in 2007 just as the market began its decline into the 2009 low.
Moreover, if you are an astute market observer, you would even recognize that the inverse expectation also rings false, as we have seen markets rally during rising rate environments. We have very clear evidence that the market even rallies during Fed rate increases, as we experienced a 1100-point (31%) rally from October 2022 until September 2023, when the Fed finally cut its rate for the first time.
And, if you are a very astute market observer, you would also realize that the Fed cut rates, added liquidity, and engaged in Quantitative Easing three times during the Covid Crash, yet the market simply continued to crash anyway.
Therefore, if you choose to be an astute market observer, and avoid the erroneous - yet common - Pavlovian-type of response of the average investor, then you should realize that the Fed’s lowering of interest rates is not the key to a certain market rally.
However, due to this Pavlovian-type of response and erroneous belief, it would seem that we are seeing historical levels of bullishness and investor exposure to the stock market.
Elliott Wave International puts out a publication called The Elliott Wave Theorist, which always includes interesting information regarding the stock market. And, I am going to present a few of their recent narratives and charts, which outline the extremes we are seeing in the market today.
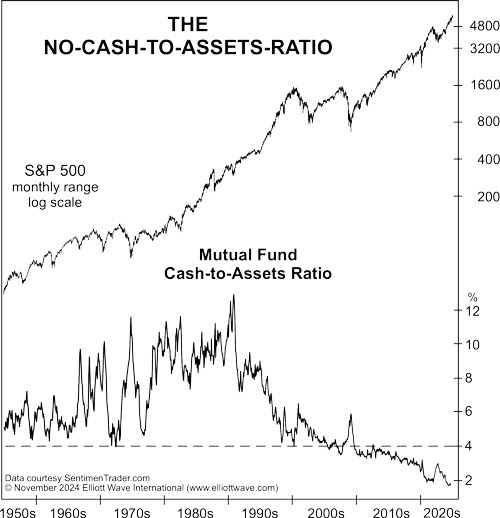
The following chart and narrative from a recent The EW Theorist highlight the low levels of cash being held by mutual funds:

“This chart shows the Investment Company Institute’s 67-year history of equity mutual funds’ cash-to-assets ratio. Equity mutual fund managers hold record low levels of cash relative to their total assets. In September, the latest data point, the ratio fell to 1.7%, matching the April through June period earlier this year for the lowest on record. Mutual fund managers have stopped waiting for bargains. Since the mutual fund cash-to-asset ratio peaked at 12.9% in October 1990, a Fibonacci 34 years ago, the main trend has been down. The ratio fell below 4% in 2009 and has never been above this level for the past 15 years. The length of this rebuff of cash speaks to the size of the next major market decline; it will be immense. Mutual fund managers have virtually no cushion to buffet against a bear market. It may be the ultimate sign of an optimistic extreme.”
Then, on November 1, Bank of America published a note outlining that, amazingly, the cash level fell even more drastically:
“US mutual funds’ cash holdings have fallen to the lowest level in Bank of America’s records going back to 2015, suggesting increasingly bullish equity sentiment that coincides with the start of the Fed’s easing cycle. The team led by Savita Subramanian says cash allocation fell to 0.6% of AUM in October from 1.6%, over five times the average monthly move of 20 basis points.”
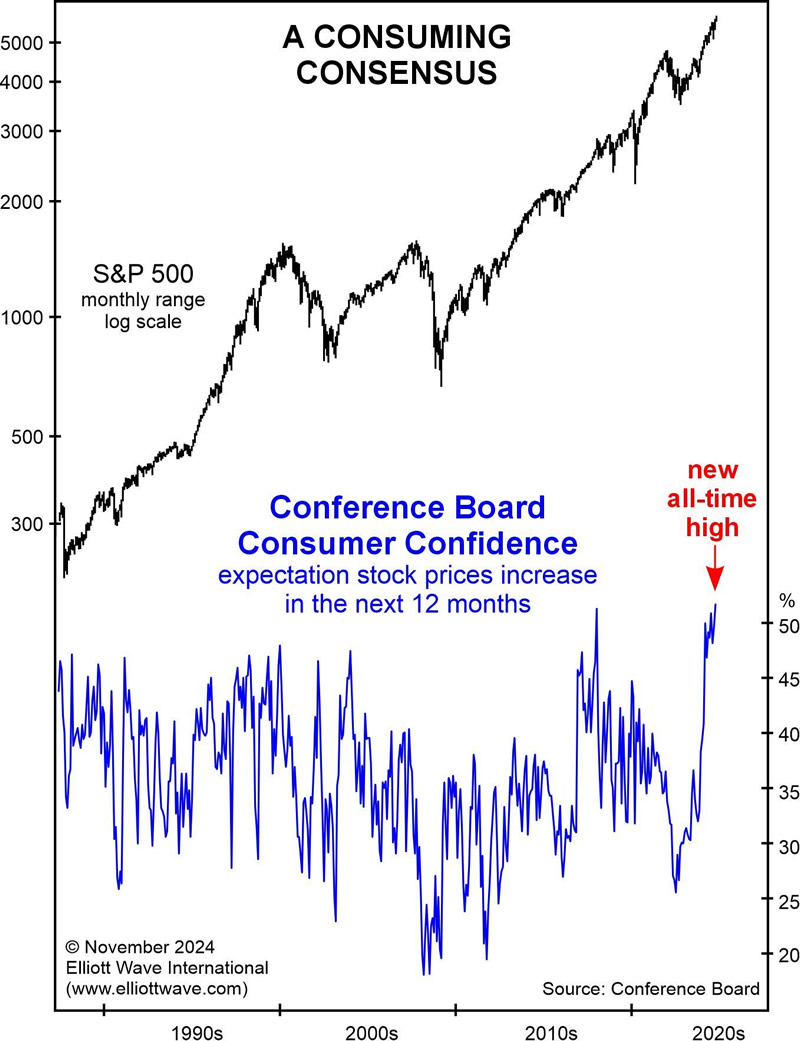
The following chart and narrative from The EW Theorist outline the public’s current view of stock investments:

“This chart of the Conference Board Consumer Confidence survey asks consumers whether they expect stock prices to increase over the year ahead. In October, the percentage rose to 51.4%, the highest in the 37 years of Conference Board monthly polling. The general public’s consensus of a rising stock market has more than doubled over the past two years, accelerating higher starting in October 2023. The intensity of the rise suggests a severe case of FOMO (fear of missing out). The run to a new record carried the five-month average to an all-time high of 49.5%, well above the prior five-month extreme of 44.9% in January 2018 (not shown), which led to a net decline over the ensuing 26 months. In the history of the survey, no other reading comes close. The public is euphoric for stocks. Why are so many investors willing to ignore the message of past sentiment extremes? They are herding non-rationally to express a historically positive financial mood. Invariably, they commit to it in the greatest number at the worst possible moment.”
The EW Theorist also highlighted the following statistics regarding US household allocations to stocks:
“The Wall Street Journal reported that U.S. households’ allocations to stocks as share of total financial assets has just reached an all-time high. In 1968, this ratio recorded a peak of 30%. In March 2000, it set a new record of 38.4%. December 2021 brought a new high of 41.6%. In the second quarter of this year, U.S. households’ equity holdings reached 42.2% (see Figure 8). It’s surely even higher now.”
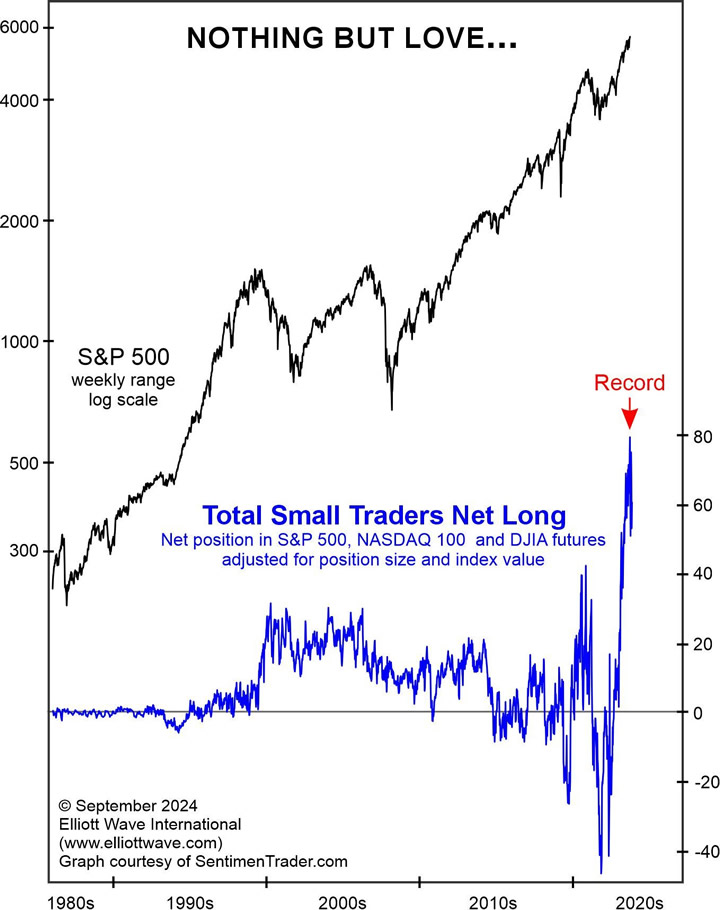
And, lastly, they outlined the speculative interest in the stock market with the following chart and narrative:

“Small Traders in [stock futures] are exuberant. They’ve been pouring money into bullish bets on the market at a dizzying pace. Small Traders’ combined net long position in S&P 500, NASDAQ 100 and Dow futures pushed to a new record net long of $79.1 billion the week of July 30, which is a whopping 88% higher than the $42 billion reading of September 2021. Retail investors are speculating on a rising stock market like never before. (Since publication, Small Traders’ net long position increased to an even greater record of $81.5 billion, which is reflected on the chart)”
This certainly sounds like we are at a bullish extreme to me. Yet, that does not equate to a conclusion that the market has indeed topped already. As Keynes once noted, “the market can remain irrational longer than you can stay solvent.”
Normally, the market completes a topping process when it concludes a 5-wave structure. While we are completing a 5th wave at many wave degrees, the final 5-wave structure seems to be taking shape as an ending diagonal. That means that we will not likely have the standard completion process we see in standard 5-wave structures, as it does cloud the analysis a bit. It is for this reason that I have been waiting for a break of support to suggest that a major top has likely been seen.
This past week, the market came within 3 points of the last target I presented to our subscribers (6020SPX) very early in the week, at which time we outlined our expectation for a pullback in our analysis. As the market provided us with our expected pullback, it then proceeded to break down below a minor support level I outlined last week. That has opened the door for the bears to provide us with a confirmation process that a long-term bear market has begun.
However, there remains a path to still take us to the 6273-6377SPX region before a top is finally struck. And, the support for that potential resides in the 5560-5670SPX region. I will be watching the manner in which we test this support quite intently in the coming weeks. Should we see a clearly corrective pattern which provides evidence of bottoming in that region, then we could have a set up pointing us to our next higher target, taking us into early 2025. However, should the market slice through that support over the coming weeks or months, then we have an early warning sign that a major bear market has potentially begun.
As I have said to many clients who ask me questions which I simply am unable to answer with certainty, I am but a simple analyst and not a prophet. Therefore, I must objectively follow what the market tells me based upon its structure. The process by which we “listen” to the market has successfully kept us on the correct side of all the markets we follow the great majority of the time, as we have caught almost all the major turns in the markets we track during the 13 years we have provided our analysis to the public.
At this point in time, we are tracking what I believe will become a major long-term market top. I have no clear and convincing evidence that we have struck that top yet, as the overlapping structure with which we are contending is attempting to cloud that path.
Now, if you believe that these are the musings of some perma-bear, may I remind you that this is the same person who called for a correction at the end of 2015 from 2100 to 1775, with an expectation thereafter for a “global melt-up.” May I remind you that this is the same person who called for a continuation rally to 2600+ in October of 2016 “no matter who wins the election next month.” May I remind you that this is the same person who suggested going long at 2200SPX with an expectation that the market was going to 4000+ despite all the negativity at the time regarding Covid.
I am hardly a perma-bear. Rather, I do my best to view the market from an objective perspective in order to remain on the correct side of the trend the great majority of the time. As one of the Seeking Alpha readers noted:
“many SA authors are constantly about buying, others are constantly forecasting the next recession (they will be right... eventually) here we have an author in the gray area..he's neither perma bull or perma bear, he's perma profit”
It is for this reason I am seeking confirmation before I proclaim a long-term bear market to have begun. That confirmation process begins with a break-down of the 5560-5670SPX region. Until then, I am maintaining an objective perspective that we can still rally to the 6273-6377SPX region before that major top is struck. And, it is this due to this objectivity, our concern for our clients’ financial well-being, and our consistent accuracy which has earned us the trust of our 8500+ subscribers and almost 1000 money manager clients through the last 13 years.
Avi Gilburt is a widely followed Elliott Wave analyst and founder of ElliottWaveTrader.net, a live trading room featuring his analysis on the S&P 500, precious metals, oil & USD, plus a team of analysts covering a range of other markets. He recently founded FATRADER.com, a live forum featuring some of the top fundamental analysts online today to showcase research and elevate discussion for traders & investors interested in fundamental rather than technical analysis.
© 2024 Copyright Avi Gilburt - All Rights Reserved Disclaimer: The above is a matter of opinion provided for general information purposes only and is not intended as investment advice. Information and analysis above are derived from sources and utilising methods believed to be reliable, but we cannot accept responsibility for any losses you may incur as a result of this analysis. Individuals should consult with their personal financial advisors.
© 2005-2022 http://www.MarketOracle.co.uk - The Market Oracle is a FREE Daily Financial Markets Analysis & Forecasting online publication.


