


Stock Market Apocalyptic Crash Soon? S&P at the Tipping Point
Stock-Markets / Financial Crash Nov 19, 2008 - 11:56 AM GMTBy: WHC_Bassetti

 A short time ago we stirred up one of the lists we belong to by commenting that the SPX might go to minus 4. We had to post a follow up to assure them that we were joking. Of course everybody hates a jester when times are like they are. Grim. In general. Here is the chart we showed them:
We measured from the top to the (presumed) neckline (depth of formation 784; price at time 780; 780- 784.) and derived a target of -4, contending that what we see here is a double top. We were joking at the time, but on reexamination we are rethinking the analysis and the joke. The thinking is apocalyptic. After all it may be a double top. If it is the prognosis is worse than grim.
We have said ad nauseam that it is not necessary to forecast in order to know what to do in the present. We are presently short and that is the way to be at present. If the low is taken out here being short may not be sufficient. Massively short would be necessary, and probably massively long precious metals. The exact consequences – or causes – of a bear market like that are unforeseeable.
At present we think the likelihood of a market implosion are not too great, but the way the world financial systems and interlocked economies are rocking on the tipping point one has to be uneasy. Right now cash and shorts are king. If super- major- hyper- ultra- inflation took place cash would deteriorate by the day. Thus, precious metals. (And large supplies of chocolate and beer.)
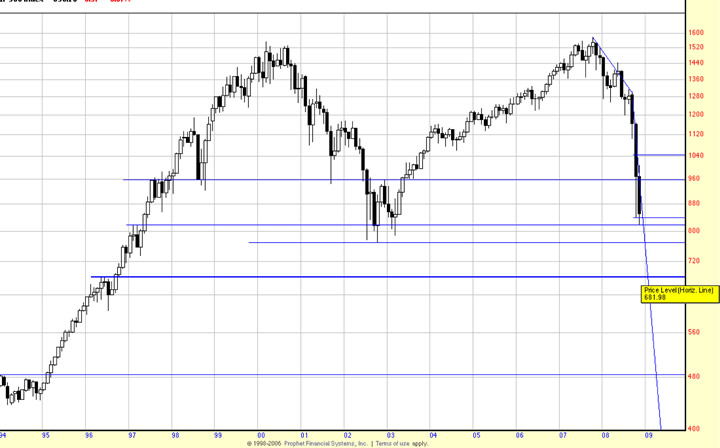
Here below are some more reasonable scenarios for the market:
Line 1 neatly coincides with the neckline of the 02-03 kilroy (h&s to you) bottom and a support zone on the upleg at left of chart. The present market price didn't even bother to wave at this line as it sliced through it.
Line 2 neatly marks a support zone on the upleg and offered some support to the 02-03 bottom. Price is hovering on this line at present. If this is taken out, and Line 3, which marks the bottom of the support zone, also falls then Line 4 represents a potential target and support. If that falls there is nothing but thin air down to Line 5.
What is the probability of markets so catastrophic? Oh, 20%. 30%. 5%. 50%?. Would you believe 60%? NO ONE knows. And it depends very much on what our esteemed political leaders do and how successful it is. You won't have to wait long to find out what the market thinks of what they do. It will inform you right away.
As always, after examining the grand context we look at the immediate situation to tell us what to do.
The present formation has a downward bias. After the panic an automatic bounce produces a high, followed by a downwave low. An upwave produces a lower high and the downwave from there, which is where we are now, produces a lower low. A close below the panic low would produce further panic.
With a market context like this it is difficult to feature buying stocks. More on that later for suicidal readers.
By WHC Bassetti
Noted technical analyst WHC Bassetti has over 40 years' experience in the financial markets and is Malcom S.M. Watts III Adjunct Professor of Finance and Economics at Golden Gate University. He is editor of the ninth edition of Technical Analysis of Stock Trends, widely considered to be one of the true classics of market analysis.
Since 1999, his website at http://www.edwards-magee.com/ has analyzed the markets with wit and accuracy. Readers have avoided the dot com bubble and subsequent bear market; invested in gold and silver before they ran away; bought oil before the blow off; been short the dollar. Now long the dollar, short the Dow since January ‘o8.
Copyright 2008 © WHC Bassetti and AC Media Holdings, Inc. All rights reserved.
Disclaimer - All information and data that is provided is solely for educational and research purposes only. Information provided does not constitute investment advice and the operators of this website, WHC Bassetti and AC Media Holdings, Inc., do not advocate the purchase, holding or sale of any security or investment. We do not provide advice regarding the suitability, profitability or potential value of any particular security or investment. Should such advice be sought, the services of a professional advisor should be obtained. All information is made available “ as is ” and “ as available ” for your personal use only and we make no representations or warranties of any kind, express or implied. Specifically, WHC Bassetti and AC Media Holdings and the operators of this website expressly disclaim any implied warranties of merchantability or fitness for a particular purpose or use.
WHC Bassetti Archive |
© 2005-2022 http://www.MarketOracle.co.uk - The Market Oracle is a FREE Daily Financial Markets Analysis & Forecasting online publication.