


The Gold Sector Starts a New 13 Week Bullish Cycle
Commodities / Gold & Silver Apr 11, 2007 - 12:38 PM GMTBy: Donald_W_Dony
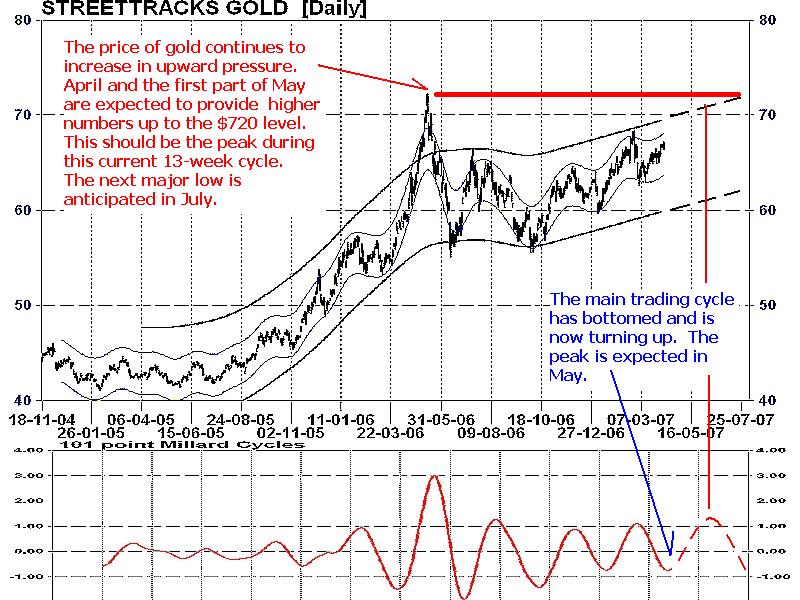
 From the correction low in early October 2006, gold has shown increasing technical strength as each new 13-week trading cycle unfolds and lifts the metal higher. This sequence of improving prices gives a good indication of expanding strength and also helps forecast the movement of this precious metal over the next few months. With a new 13-week trading cycle developing in the first half of April (see the lower portion of Chart 1), a price peak can be anticipated mid-point (second half of May) at a level of near $720. The next trough should form in late June.
Thought the global fundamental supply /demand balance continues to favour the latter for gold, an increasingly frail U.S. dollar clearly helps encourage support.
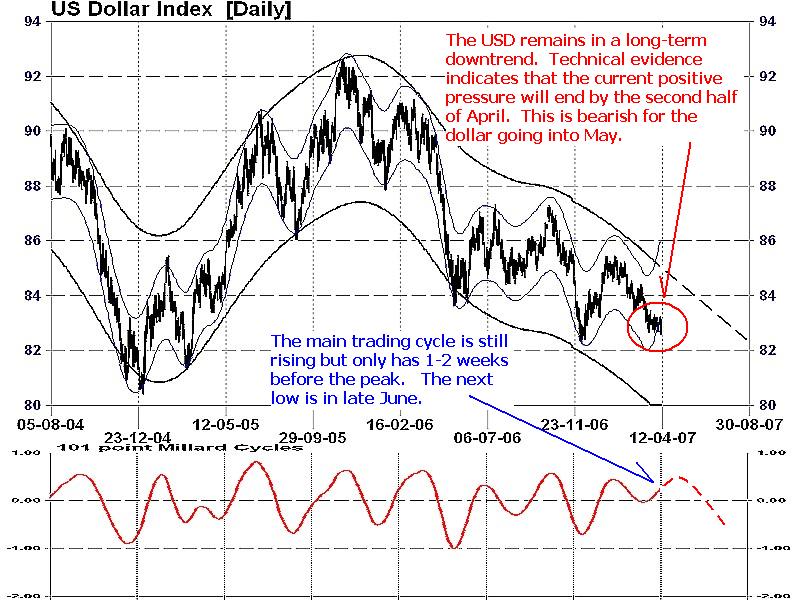
The U.S. dollar (Chart 2) has proven once again how weak it is to the international investment community. From late March to mid-April 2007, there was increasing upward pressure, yet the currency only moved sideways. This trading action indicates the amount of bearish weight that rests on the USD. During similar trading patterns (ie. early December and September 2006), bullish buying was able to advance the dollar considerably. This time, bullish pressure was only able to stale the long-term decline by several weeks. This is a very negative sign for the dollar. The technical outlook for the U.S. currency in May is to test near the $0.80 level. This expected slide is positive for gold and the gold indexes.
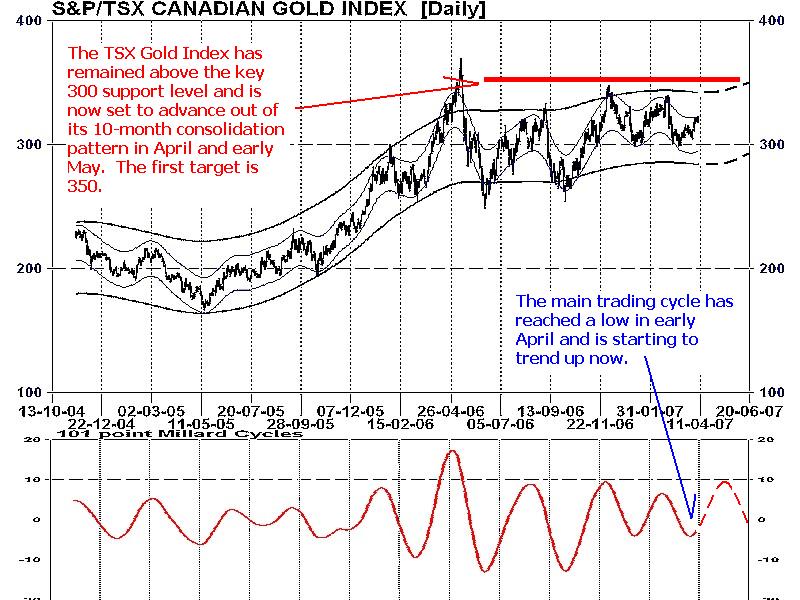
The Canadian gold sector (Chart 3) has staged a slow upward price progression since mid-2006 but still remains pinned in a trading range. From a relative strength perspective, this group of stocks has lagged the TSX Composite Index for over 12 months. However, signs of modest growth are evident with the Gold Indexs ability to remain above the key 300 support line since November 2006. This level signifies the next higher ladder step. With a new 13-week trading cycle beginning in the first half of April, a price peak can be expected in the second half of May (top of the cycle) at 350 and the next major low in early July. Summer often provides range-bound pricing in precious metals and then sets the stage for increasing upward strength in the 3rd and 4th quarters.
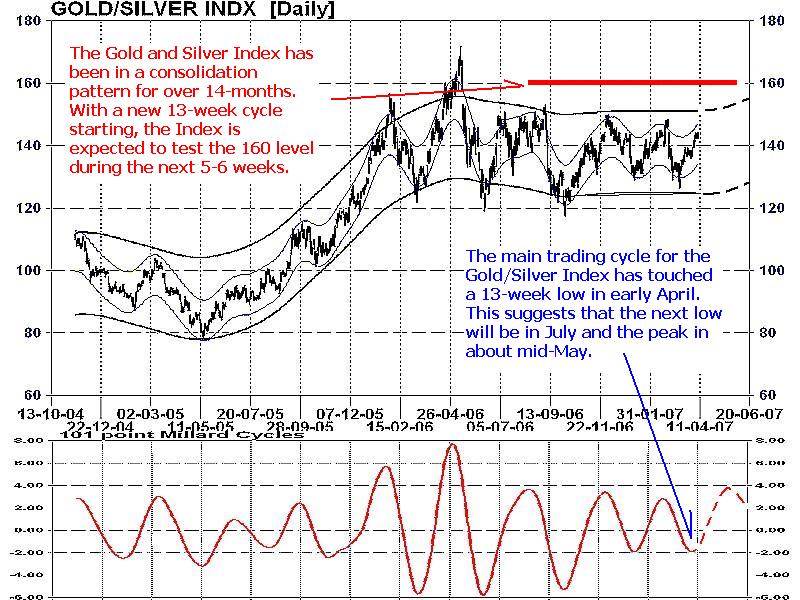
The Philadelphia Gold and Silver Index (Chart 4), similar to the Canadian gold sector, have been held in a trading range between 120 and 155 for over 12 months. The evidence of a new trading cycle commencing in early April shows promise of increasing buying pressure and the potential of breaking the upper boundary of 155. Only a move over 160 would indicate the consolidation is finished and an up trend has begun. However, the potential for this action is limited during this cycle.
INTERMARKET PERSPECTIVE: As commodities move in anticipation to inflation and gold is the most inflation-sensitive commodity, its gradual rise points to continuing global inflationary pressure and not a slow cooling of world economies in 2007. And as gold normally leads the other commodities, it also indicates that most natural resources will follow in a similar upward path. Oil in particular, often parallels gold progress. The recent strength in gold suggests that energy prices will remain firm at current levels and energy stocks will advance in April and May.
MY CONCLUSION: After months of consolidation, the precious metal sectors will be testing their upper ranges in late April and May. This move appears to be part of a larger change of trend from flat to up. Further improvement in prices and additional time will be required before a true breakout to new highs develops, but technical evidence is mounting to signify that the second half of 2007 will provide greater performance.
More information on the gold sector and commodities is in the latest newsletter. Go to www.technicalspeculator.com and click on member login to access the April issue.
Your comments are also welcomed.
By
Donald W. Dony, FCSI, MFTA
www.technicalspeculator.com
COPYRIGHT © 2007 Donald W. Dony
Donald W. Dony, FCSI, MFTA has been in the investment profession for over 20 years, first as a stock broker in the mid 1980's and then as the principal of D. W. Dony and Associates Inc., a financial consulting firm to present. He is the editor and publisher of the Technical Speculator, a monthly international investment newsletter, which specializes in major world equity markets, currencies, bonds and interest rates as well as the precious metals markets.
Donald is also an instructor for the Canadian Securities Institute (CSI). He is often called upon to design technical analysis training programs and to provide teaching to industry professionals on technical analysis at many of Canada's leading brokerage firms. He is a respected specialist in the area of intermarket and cycle analysis and a frequent speaker at investment conferences.
Mr. Dony is a member of the Canadian Society of Technical Analysts (CSTA) and the International Federation of Technical Analysts (IFTA).
© 2005-2022 http://www.MarketOracle.co.uk - The Market Oracle is a FREE Daily Financial Markets Analysis & Forecasting online publication.