


Gold and Silver Bullish Fundamentals- Keep Your Eye on the Prize
Commodities / Gold & Silver Nov 21, 2008 - 04:31 PM GMTBy: Peter_Degraaf

 In this fast-moving age, it is so easy to take your eye of the prize. Short-term trends can easily throw one ‘off track'. For every analyst who will tell you a stock or commodity is going up, there is another one who will tell you it is going down in price.
Who to believe?
When in doubt, consult the longer term charts! On my website www.pdegraaf.com I provide a collection of about 20 long-term charts that help me (and will help you), to keep your eye on the prize!
These charts are updated at regular intervals and there is no charge for looking.
One powerful force that is currently causing many people to take their eye off the prize is the outcry of deflation. While there can be no doubt that there is ‘asset deflation' going on, (houses, used cars, stocks and many commodities) are tumbling downhill as people panic. There is however no ‘monetary deflation' going on. On the contrary, there is currently unprecedented ‘monetary INFLATION' taking place, and never before in history have so many countries inflated the various money supplies with this much additional money in such a short period of time.
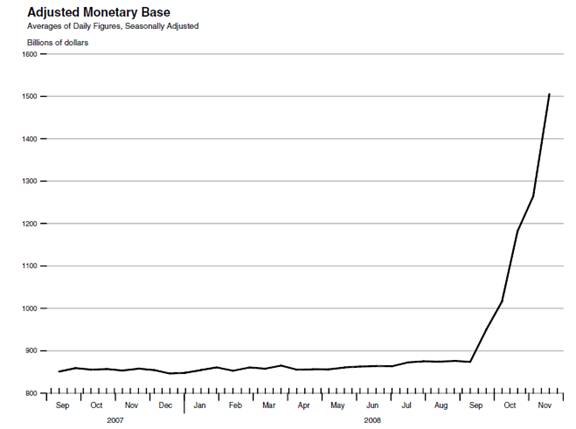
The Federal Reserve has just updated its latest Adjusted Monetary Base chart (courtesy St. Louis Fed). Since early September the increase is 650 billion. On an annualized basis this is an increase of 450%. The reason this monetary inflation has (not yet) shown up in consumer price is for two reasons. First, too many people are mesmerized by the assets deflation that is going on around them and second, it takes time for money to work its way through the system.
If history is a guide (and it is), then you can bet the farm that monetary inflation ALWAYS results in price inflation down the road.
Here is a partial listing of countries that have been down this road. (Thanks to Jim Sinclair – www.jsmineset.com for this list.
Angola 1991-1999
Argentina 1981 – 1992
Belarus 1993 – 2008
Bolivia 1984 – 1986
Bosnia – Herzegovina 1992 – 1993
Brazil 1986 -1994
Chile 1971 – 1981
China 1948 – 1955
Georgia 1993 -1995
Germany 1919 -1923
Greece 1943 – 1953 At the high point prices doubled every 28 hours. Greek inflation reached a rate of 8.5 billion percent per month.
Hungry 1944 – 1946
Israel 1971 – 1985 (price controls instituted)
Japan 1934 – 1951
Nicaragua 1987 – 1990
Peru 1987 – 1991
Poland 1990 – 1994
Romania 1998 – 2006
Turkey 1990 – 2001
Ukraine 1992 – 1995
USA 1773 – not worth a Continental
Yugoslavia 1989 – 1994
Zaire 1989 – present (now the Congo)
Zimbabwe – 2000 to present. November of 2008 – inflation rate of 516 quintillion percent
From http://en.wikipedia.org/wiki/Weimar Republic

The photograph shows a German young lady using worthless paper money to heat her home in 1923.
The above list does not include a number of countries that saw hyper-inflation as a result of World War II.
Why does history repeat? The answer is human nature. The officials in charge of the money supply, whether is was the Czar, the King, Caesar or the head of a central bank, simply cannot resist the ‘easy way out' of a monetary crisis, by adding to the money supply.
Here is an example of the consequence of monetary inflation. Imagine yourself in an auction hall. Just before the auction begins, a rich man walks in with a briefcase filled with hundred dollar bills. He hands a few to each of the patrons, till his briefcase is empty. What do you think is going to happen to the prices at the auction? This is exactly what happens in the larger economy.
How do you protect yourself from the ravages of monetary inflation? You buy the things that government cannot produce, such as: income property in an area where prices are stable, or have just come down in price. Stock in companies that produce goods that we cannot live without, including oil and gas producers, since we are a long way from converting to alternate sources of energy.
Finally, and this is the simplest protection against monetary inflation: Buy some gold and silver.
For some 5,000 years gold has provided a safe haven against the ravages of inflation.
While there are periods when it behooves the investor to cash in his gold, during periods of monetary inflation (like now), gold and silver are a must in any portfolio.
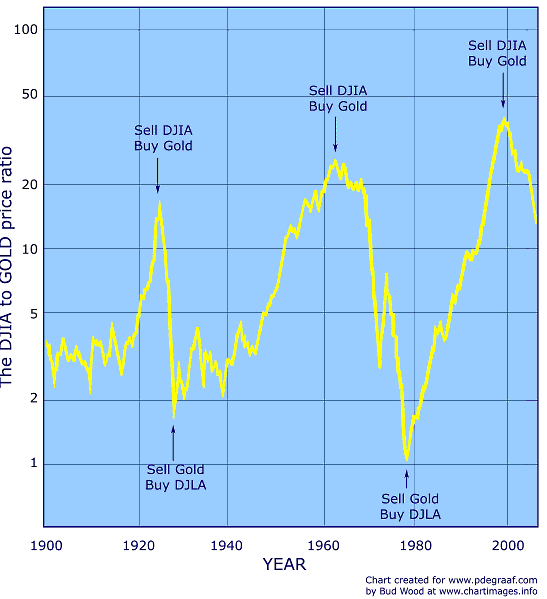
Featured is a 100 year chart that shows you when to be ‘in gold' and when to be ‘out of gold'. Clearly now is a time to be ‘in gold', and not to worry about the daily fluctuations!
This is the most important chart any investor needs , to look at for the long-term direction of both the DOW and gold.
Those of you with a shorter time-frame, might like to keep an eye on ‘real interest rates'. Real rates are T-bills less the cost of living, or CPI. While the official CPI is usually less than totally reliable, (due to massaging of numbers), we will use the chart provided by the St. Louis Federal Reserve Bank for this article, and for those who are skeptical, we would recommend using the information provided by John Williams at www.shadowstats.com
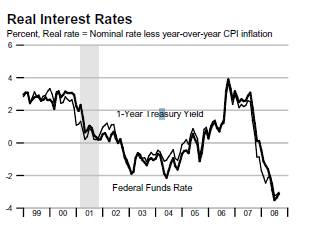
Chart courtesy St. Louis Fed.
As seen by this chart, the ‘official real rate' of interest is currently -3.5%. Gold always flourishes while rates are negative. While some will argue that inflation expectations will be lowered due to the lower oil and wholesale prices of agricultural commodities, we must remember that the effect of ‘negative real interest rates' take a long time to change peoples investing behavior. ‘Real rates' would have to be positive for a year or more before the effects of negative rates would be erased.
BULLISH GOLD FUNDAMENTALS.
The World Gold council www.mediacentre.gold.org has just issued a report with some very bullish ‘nuggets'.
- Dollar demand reached an all-time quarterly record of US $332 Bn in Q3/08.
- This figure was 45% higher than the previous record set in Q2/08.
- ETF's are sitting on 382 tonnes, double last year's tonnage.
- Retail investment demand rose 121% to 232 tonnes in Q3/08.
- Demand in Greater China rose 18% to 109 tonnes, with the majority of this increase attributable to a strong rise in demand in mainland China (+16 tonnes).
- Jewelry demand in the Middle East rose 47% to US $2.8B in Q3/08.
- Gold supply was down 9.7% from year ago levels.
My sources in Switzerland reported this morning that two Swiss banks (UBS and Credit Suisse) have written off US$60 billion dollars. You know it's bad when even the conservative Swiss bankers are having problems.
There are also rumors, as yet unconfirmed, that the Swiss no longer keep financial information secret from the IRS. If this turns out to be factual, it will cause money to move from Swiss bank accounts into gold.
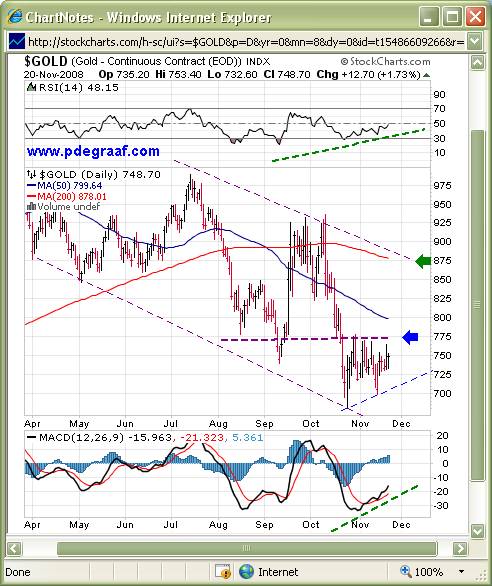
Chart courtesy www.stockcharts.com
We close with the daily gold chart. Price has put in an ABC bottom. The RSI and MACD are positive. A close above the blue arrow sets up a target at the green arrow. My Gold Direction Indicator is at +85% this morning. While this article is focused on gold, the fundamentals for silver are even more bullish than for gold. The ratio between gold and silver has widened to 83:1, while the historical ratio is 15:1, and my research leads me to conclude that the ratio will narrow to 10:1 over time.
By Peter Degraaf
Peter Degraaf is an on-line stock trader with over 50 years of investing experience. He issues a Weekend Report on the markets to his many subscribers. A sample copy of a recent report is available upon request. Long-term charts are available as a free service at his website www.pdegraaf.com (Due to time constraints and growing administrative costs he no longer offers a free trial service).
DISCLAIMER: Please do your own due diligence. I am NOT responsible for your trading decisions.
Peter Degraaf Archive |
© 2005-2022 http://www.MarketOracle.co.uk - The Market Oracle is a FREE Daily Financial Markets Analysis & Forecasting online publication.