


Gold Breakout, Re-run of September Price Action?
Commodities / Gold & Silver Nov 30, 2008 - 08:32 PM GMTBy: Merv_Burak

 Is this September all over again, a sharp couple day rally and then a more casual topping out and decline? This time the rally didn't even come close to the 200 day moving average line which has now turned to the down side. But who knows, maybe this time it's different.
GOLD : LONG TERM As mentioned last week the long term P&F chart, although showing a valid upside (bullish) break-out, is still a weak break and projects only to the top of the Sept-Oct highs. That does not make for a strong long term reversal. Other than an extra X during the latest move the P&F remains as it was last week.
As for the usual suspects, the price of gold remains below its negative sloping long term moving average line. The long term momentum indicator (using the daily version) is still just slightly inside its negative zone but above its positive sloping trigger line. The volume indicator is not yet in a strong rally mode and is more in a lateral mode. It is, however, above its long term trigger line but the trigger continues to slope downward. Putting all these together we still have a long term rating of BEARISH .
INTERMEDIATE TERM
Since topping out in March gold has been going through a steady diet of lower highs and lower lows. Unfortunately the intermediate term momentum indicator has been following the same pattern. Fortunately, the intermediate term momentum has now provided us with a positive divergence having bottomed out during this latest decline at a level higher than its previous bottom while gold itself had moved lower. So, although the sharp rally of the past week may look much like the rally of Sept the difference is in the strength of the rally. This time it is coming from a higher strength level so it just might become something more than a rally. A more positive sign of its strength this time would be to see if the momentum indicator could move comfortably above its previous rally high. So far it has not. But let's see what the indicators are doing.
Gold moved above its intermediate term moving average line a week ago and still remains above the line. The moving average line has now turned oh so gently towards the up side but without any degree of strength yet. As mentioned above, the intermediate term momentum indicator has shown us a positive divergence versus gold price action. It has just very slightly breached its neutral line and is uncomfortably in its positive zone. It is above its positive sloping trigger line. As for the volume indicator, as mentioned in the long term analysis the volume indicator is in more of a lateral drift than in any rally mode. It is, however, above its intermediate term positive sloping trigger line. From these indicators the intermediate term rating has now moved into the BULLISH category, but at this point it is only a mild bullish until the move further validates itself.
SHORT TERM
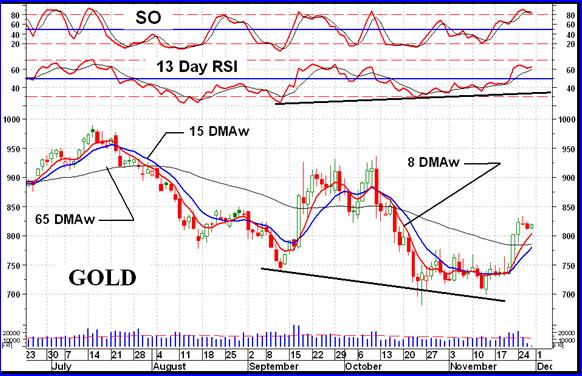
The positive divergence mentioned in the intermediate term analysis can also be seen here in the short term indicator. This would normally suggest to us a rally of some magnitude but I like to see some better confirmation of the move. However, for now the indicators are positive. Gold is trading above its short term moving average line (15 DMAw) and the line slope is pointing upwards. The short term momentum indicator (13 Day RSI) is inside its positive zone and above its positive trigger line.
It is, however, showing weakness as the week ended and must be watched for a move below its trigger. I also show on the chart a 50 day average line of the daily volume for no other reason than a reference as to what the volume is doing. Due to the U.S. Thanksgiving holiday the volume activity was quite low versus the average but this should perk up during this coming week. One last short term indicator that suggests we are still in a short term rally is the fact that the very short term moving average line remains above the short term line. All in all the short term must still be rated as BULLISH .
As for the immediate direction of least resistance, that seems to be moving towards the down side. Although gold is still above its very short term moving average line it has stopped rallying and seems to have topped out. The next few days might give us a better picture if this is a top or just a short holiday rest. As for the momentum (strength) of the recent move, the Stochastic Oscillator had moved into its overbought zone a few days back but has now turned downward and has crossed below its trigger line. It is still, however, in its overbought zone and has not yet crossed the overbought line to the down side. The immediate direction of least resistance seems to be towards the down side but needs another day or two for confirmation. The lack of activity during the Thanksgiving period does mess up the indicators somewhat.
SILVER
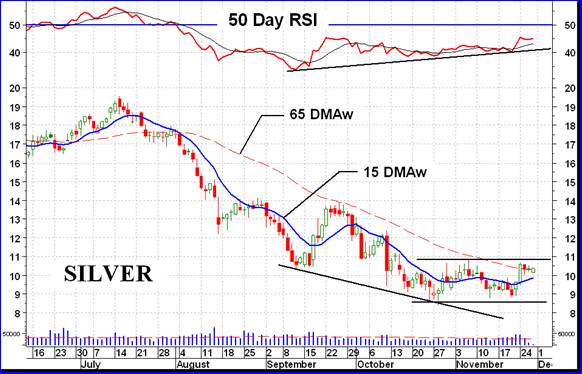
Whereas gold made its big move a week ago Friday it took silver an extra day to make its big move. The performance therefore shows up on this week's information and makes silver look like it has now out performed gold. That's not yet true. In looking at the chart silver still is lagging gold and has not yet broken above its month and a half resistance level. It would need a move to the $11.00 level to do that. The indicators are, however, starting to turn positive for silver. Short term wise silver is trading above its short term moving average line and the line has turned upwards. The short term momentum indicator is in its positive zone and above its positive trigger line. And the silver stocks had one of their best weeks in some time. All in all, the short term can only be rated, at this time, as BULLISH for silver.
On the intermediate term things are not quite that positive but drifting in that direction. Silver is toying with its intermediate term moving average line but the line remains pointing in a downward direction. The momentum indicator, which has given us a positive divergence warning, is moving higher above its trigger line but still below its neutral line in the negative zone. For now the best I can rate the intermediate term is a + NEUTRAL rating.
PRECIOUS METAL STOCKS
WOW, was that some week or what? Looking at the Table of Precious Metals Indices, below, one would think that the bull is back in full swing. Except for the gambling variety of stocks it was double digit gains all over the place. Once again it was the “quality” stocks that moved the most, but not by much. This time the secondary stocks also had their day. Some time back I used to show the number of weekly plus/minus 30% weekly movers. This week we had the most weekly movers of over 30% since so far back that I can't recall. There were 26 stocks from the universe of 160 that gained more than 30% on the week.
There were 4 that lost more than 30% but that still left a plurality of 22 on the up side. This was a super week that I don't see being equaled anytime soon. Speculators should not take this one week as a portend of things to come. Despite the super week for the stocks only the short term has shown a bullish summation of ratings in the universe of 160. The summation of rating now stand at short term BULL 64%, BEAR 20%, intermediate term BULL 32%, BEAR 49% and long term BULL 4%, BEAR 88%. So there is still work to do before we can get all comfortable and fuzzy on the future, but for now it is heading in that direction.
Merv's Precious Metals Indices Table
Let's call it another week.
By Merv Burak, CMT
Hudson Aero/Systems Inc.
Technical Information Group
for Merv's Precious Metals Central
For DAILY Uranium stock commentary and WEEKLY Uranium market update check out my new Technically Uranium with Merv blog at http://techuranium.blogspot.com .
During the day Merv practices his engineering profession as a Consulting Aerospace Engineer. Once the sun goes down and night descends upon the earth Merv dons his other hat as a Chartered Market Technician ( CMT ) and tries to decipher what's going on in the securities markets. As an underground surveyor in the gold mines of Canada 's Northwest Territories in his youth, Merv has a soft spot for the gold industry and has developed several Gold Indices reflecting different aspects of the industry. As a basically lazy individual Merv's driving focus is to KEEP IT SIMPLE .
To find out more about Merv's various Gold Indices and component stocks, please visit http://preciousmetalscentral.com . There you will find samples of the Indices and their component stocks plus other publications of interest to gold investors.
Before you invest, Always check your market timing with a Qualified Professional Market Technician
Merv Burak Archive |
© 2005-2022 http://www.MarketOracle.co.uk - The Market Oracle is a FREE Daily Financial Markets Analysis & Forecasting online publication.