


Weekly Stock Market Technical Analysis Report - 14th April 2007
Stock-Markets / US Stock Markets Apr 14, 2007 - 03:00 PM GMTBy: Mike_Burk

The good news is-
• The S&P mid cap index (MID) hit an all time high Friday.
• Next week is seasonally one of the strongest weeks of the year.
Short Term
Last Wednesday the MID ended its 2nd consecutive string of 8 consecutive up days for the year. You have to go back to April - June 2004 to find a similar performance. Following the late June 2004 string of 8 consecutive up days the index made an intermediate term high about a month later.
What has been defining this market is a lack of sellers.
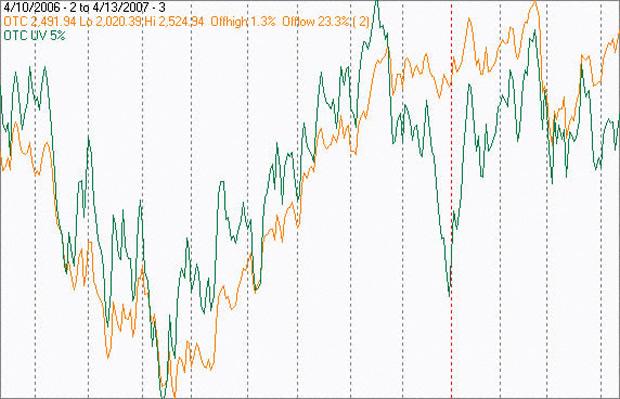
The chart below covers the past year showing the NASDAQ composite (OTC) in red and a 5% trend (39 day EMA) of volume of NASDAQ advancing issues (OTC UV) in green. There are dashed vertical lines drawn on the 1st trading day of each month and the vertical line is red on the 1st trading day of the year.
OTC UV rose from the lows last summer and peaked with the mid November high. You can ignore the dip in late December as that is a typical seasonal phenomenon. There was a slightly lower high near the late February high in the index, but, since then the OTC UV has been subdued and is near its March lows.
The next chart covers the same period as the one above, but the indicator is a 5% trend of the volume of NASDAQ declining issues (OTC DV). OTC DV is plotted on an inverted Y axis so increasing volume moves the indicator downward (up is good).
Since the early March lows OTC DV has moved sharply upward indicating diminishing OTC DV.
The rally off the March lows has not been from aggressive buying, but a lack of sellers.
Intermediate term
A summation index (SI) is a running total of oscillator values.
The chart below covers the past year showing the OTC in red and SI's calculated from oscillators of NASDAQ advancing - declining issues (OTC AD SI), new highs - new lows (OTC HL SI) and volume of advancing issues - volume of declining issues (OTC UD SI).
OTC AD SI and OTC UD SI are moving upward while OTC HL SI has turned downward.
Seasonality
Next week is the week prior to options expiration Friday in April during the 3rd year of the Presidential Cycle.
The tables show the NASDAQ composite (OTC) from 1963 - 2003 during the 3rd year of the Presidential Cycle and SPX data beginning with 1955. SPX data prior to 1953 has been omitted because the market traded 6 days a week.
There are summaries for both the 3rd year of the Presidential Cycle and all years combined.
On average, next week has been remarkably strong. Since 1963 the OTC has been up 82% of the time while the SPX has only been down once, in 1987, giving it a 92% winning record. Both indices have had an average return in excess of 1% for the week.
Report for the week before the 3rd Friday of April
The number following the year is the position in the presidential cycle.
Daily returns from Monday through 3rd Friday.
| OTC Presidential Year 3 | ||||||
| Year | Mon | Tue | Wed | Thur | Fri | Totals |
| 1963-3 | 0.56% | 0.31% | 0.34% | 0.30% | 0.30% | 1.81% |
| 1967-3 | 0.40% | 0.57% | 1.23% | 0.31% | 0.49% | 3.01% |
| 1971-3 | 0.18% | -0.57% | -0.01% | 0.43% | 0.64% | 0.67% |
| 1975-3 | 1.34% | 0.23% | 0.63% | 0.33% | -0.23% | 2.30% |
| 1979-3 | 0.15% | 0.31% | 0.36% | -0.10% | -0.20% | 0.52% |
| 1983-3 | 0.44% | -0.34% | 1.05% | 0.71% | 0.60% | 2.45% |
| Avg | 0.50% | 0.04% | 0.65% | 0.34% | 0.26% | 1.79% |
| 1987-3 | -0.41% | 0.20% | -0.10% | -0.17% | -1.15% | -1.64% |
| 1991-3 | -0.16% | 1.18% | 0.90% | -0.92% | -1.07% | -0.06% |
| 1995-3 | 0.66% | 0.29% | 0.68% | 0.48% | 0.36% | 2.47% |
| 1999-3 | -2.00% | 2.00% | 2.00% | 2.00% | 1.16% | 5.16% |
| 2003-3 | -0.08% | 1.89% | 1.02% | -0.61% | -1.56% | 0.67% |
| Avg | -0.40% | 1.11% | 0.90% | 0.16% | -0.45% | 1.32% |
| OTC Summary for Presidential Year 3 1963 -2003 | ||||||
| Avg | 0.10% | 0.55% | 0.74% | 0.25% | -0.06% | 1.58% |
| Win% | 64% | 82% | 82% | 64% | 55% | 82% |
| OTC Summary for all years 1963 - 2006 | ||||||
| Avg | -0.11% | 0.10% | 0.16% | 0.22% | 0.03% | 0.40% |
| Win% | 51% | 53% | 68% | 64% | 59% | 68% |
| SPX Presidential Year 3 | ||||||
| Year | Mon | Tue | Wed | Thur | Fri | Totals |
| 1955-3 | 0.82% | -0.13% | 0.16% | 0.10% | -0.81% | 0.14% |
| 1959-3 | 0.37% | 0.50% | 0.44% | 0.83% | 0.85% | 2.99% |
| 1963-3 | 0.10% | 0.33% | 0.27% | 0.06% | -0.09% | 0.68% |
| 1967-3 | 0.71% | 0.87% | 0.09% | 0.18% | 0.21% | 2.05% |
| 1971-3 | 0.50% | -0.38% | -0.24% | 0.19% | 0.47% | 0.54% |
| 1975-3 | 1.69% | 0.82% | 0.35% | 0.75% | -1.09% | 2.51% |
| 1979-3 | 0.34% | 0.62% | 0.29% | -0.48% | -0.21% | 0.57% |
| 1983-3 | 0.62% | -0.64% | 1.26% | -0.41% | 0.23% | 1.06% |
| Avg | 0.77% | 0.26% | 0.35% | 0.05% | -0.08% | 1.35% |
| 1987-3 | -0.29% | 2.00% | -2.00% | -0.13% | -1.85% | -2.26% |
| 1991-3 | 0.21% | 1.69% | 0.73% | -0.51% | -1.10% | 1.02% |
| 1995-3 | 0.87% | -0.14% | 0.10% | 0.17% | 0.23% | 1.22% |
| 1999-3 | -2.00% | 1.30% | 2.00% | 1.70% | -0.14% | 2.85% |
| 2003-3 | -0.18% | 2.00% | 0.84% | -0.83% | -1.38% | 0.45% |
| Avg | -0.28% | 1.37% | 0.33% | 0.08% | -0.85% | 0.66% |
| SPX summary for Presidential Year 3 1955 - 2003 | ||||||
| Avg | 0.29% | 0.68% | 0.33% | 0.13% | -0.36% | 1.06% |
| Win% | 77% | 69% | 85% | 62% | 38% | 92% |
| SPX summary for all years 1953 - 2006 | ||||||
| Avg | -0.04% | 0.19% | 0.03% | 0.11% | -0.13% | 0.15% |
| Win% | 50% | 52% | 58% | 61% | 46% | 67% |
Mutual Fund
Compliance issues demand that I not mention the mutual fund that I manage by name or symbol in this letter.
To see a current chart of the fund go to:
http://finance.yahoo.com/q/bc?s=APHAX&t=3m
For information about the fund go to: http://www.thealphafunds.com/index.htm
The fund now has service class shares available.
Conclusion
Seasonally, next week as been too strong to ignore.
I expect the major indices to be higher on Friday April 20 than they were on Friday April 13.
By Mike Burke
Mike Burk is an employee and principle of Alpha Investment Management (Alpha) a registered investment advisor. Charts and figures presented herein are believed to be reliable but we cannot attest to their accuracy. The views expressed are provided for information purposes only and should not be construed in any way as investment advice. Furthermore, the opinions expressed may change without notice. To subscribe to this report : http://alphaim.net/signup.html
© 2005-2022 http://www.MarketOracle.co.uk - The Market Oracle is a FREE Daily Financial Markets Analysis & Forecasting online publication.