Silver Analysis - Trending higher towards Resistance
Commodities / Gold & Silver Apr 15, 2007 - 11:01 PM GMTBy: Roland_Watson
 Here are the latest numbers on silver as of this weekend with changes on the week in parentheses (acronyms are explained at bottom):
London Silver Fix Price: $13.88 (+$0.30 on week)
NYMEX Spot Price: $14.01 (+$0.33)
RSI: 64.88 (+5.76) ( 70 overbought/30 oversold - short term top-bottom indicator )
RMAR: 1.02 (+0.01) ( 1.30 overbought - monthly to yearly top indicator )
NYMEX SLI: 1.51 (-0.01) (1.80 overbought - multi-year top indicator )
GSR: 49.12 (-0.47) ( 15.00 silver overbought - multi-decade top indicator )
SLD: 2.65 (-0.01)
GLD: 1.67 (+0.02)

Silver continues to advance but as yet no new highs have been achieved. The RSI for silver is now beginning to overheat as it hits a value of 64.88 and should advance into overbought territory in the days and weeks ahead subject to minor corrections slowing it down. To me there does not seem enough strength in this current move to reach the old high of last February before it is pulled down. I was neutral on that last week but am more inclined to the negative now. However, it could still take a couple of weeks to enter the overbought zone as old highs are challenged. Meanwhile, the gap between the 50 day and 200 day moving averages has widened slightly to 82 cents (78 cents last week) as we anticipate a pre-breakout meeting of the two.
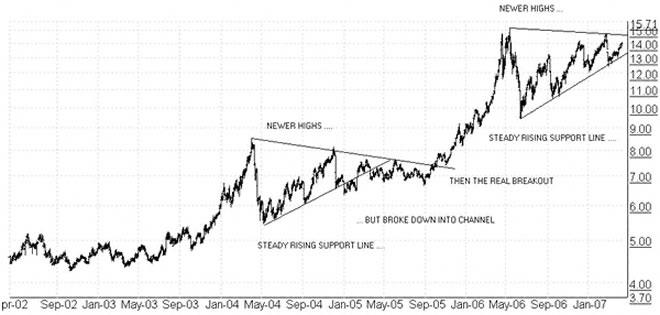
That brings me to some observations on the vagaries of analysing price trends. As some commentators have pointed out, silver has been advancing on a rising support level which can be drawn across the sequence of increasingly higher lows. That sounds bullish and it may yet prove to be but an analysis of the last good sized correction in silver between April 2004 and August 2005 suggests caution. The chart is attached to this email for you to follow.
Note how after the big drop in April 2004, silver also advanced in a similar fashion to our current moves on a rising trend line until the old highs of $8.50 were nearly taken out in December 2004. However, this trend broke to the downside to begin a channel movement for silver for some months before the true breakout occurred in September 2005.
Will our current rising trend line support the price of silver or will we see a temporary breakdown? That previous rising trend line lasted 8 months. This current one has lasted 10 months. Once again, a breaking of the previous high of late February is required to maintain the bullish sequence of higher highs and invalidate that analysis.
KEYWORDS:
RSI: R elative S trength I ndex
RMAR: R elative 200 day M oving A verage ( R efined)
SLI: S ilver L everage I ndicator
GSR: G old to S ilver R atio
SLD: S ilver L everage to US D ollar on a four year rolling basis
GLD: G old L everage to US D ollar on a four year rolling basis
By Roland Watson
http://silveranalyst.blogspot.com
Further analysis of the SLI indicator and more can be obtained by going to our silver blog at http://silveranalyst.blogspot.com where readers can obtain the first issue of The Silver Analyst free and learn about subscription details. Comments and questions are also invited via email to silveranalysis@yahoo.co.uk .
© 2005-2022 http://www.MarketOracle.co.uk - The Market Oracle is a FREE Daily Financial Markets Analysis & Forecasting online publication.


