Leadership Stocks Ratio Turning Bullish?
Stock-Markets / US Stock Markets Dec 10, 2008 - 05:41 AM GMTBy: Marty_Chenard
 Is the Leadership Stock Ratio on the cusp of going positive?
In the stock market, it can be said that there are two subsets of stocks ... Leadership stocks and Broad Market stocks.
Their interaction behavior is much like the scenario between the battalion leader, and his troops. In a battle, if the strength and confidence of the Leader is strong, it will effect the battalion in a positive way propelling them into battle with the fervor needed. In the stock market, it is not much different.
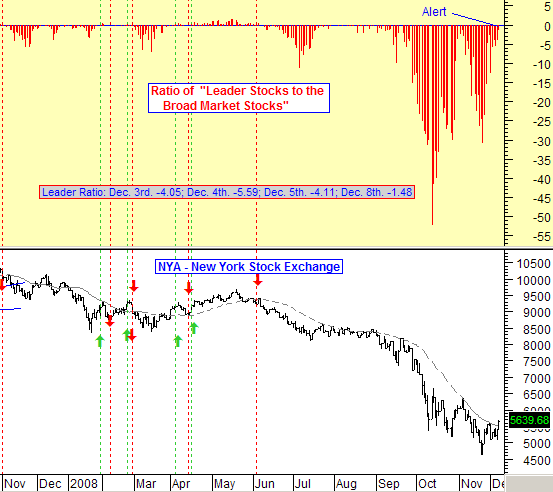
In today's Leadership Ratio chart, we measure the strength of the Leadership stocks and compare it to the strength of the Broad Market stocks. We then divide the two numbers and create a Ratio that shows if the Leaders are moving forward or retreating relative to the troops (the Broad Market stocks.)
So what is the Leadership Ratio saying now?
1. That the Leadership stocks have been gaining momentum.
2. That the Leadership stocks are now close to the Neutral/Positive line that could give the market an upside thrust.
3. But, there is a Caution warning at the same time. The current Leadership Stock Ratio is -1.48 and when the ratio got close to the neutral line in early November, it stalled and headed right back down taking the market with it.
The bottom line is that Leadership stocks are gaining momentum, but they are not "out of the woods" yet. One plus that didn't happen in early November: The NYA Index never made it above its trend line, yesterday it did.
Quick note: All paid subscribers should login for today's alert message.

____________________________________________________________________
*** Feel free to share this page with others by using the "Send this Page to a Friend" link below.
By Marty Chenard
http://www.stocktiming.com/
Please Note: We do not issue Buy or Sell timing recommendations on these Free daily update pages . I hope you understand, that in fairness, our Buy/Sell recommendations and advanced market Models are only available to our paid subscribers on a password required basis. Membership information
Marty Chenard is the Author and Teacher of two Seminar Courses on "Advanced Technical Analysis Investing", Mr. Chenard has been investing for over 30 years. In 2001 when the NASDAQ dropped 24.5%, his personal investment performance for the year was a gain of 57.428%. He is an Advanced Stock Market Technical Analyst that has developed his own proprietary analytical tools. As a result, he was out of the market two weeks before the 1987 Crash in the most recent Bear Market he faxed his Members in March 2000 telling them all to SELL. He is an advanced technical analyst and not an investment advisor, nor a securities broker.
Marty Chenard Archive |
© 2005-2022 http://www.MarketOracle.co.uk - The Market Oracle is a FREE Daily Financial Markets Analysis & Forecasting online publication.


