


Stock Market Extreme Panic Volatility
Stock-Markets / Volatility Dec 12, 2008 - 12:34 PM GMTBy: Zeal_LLC

 If it is not already happening, someday soon some entrepreneur will start selling t-shirts proclaiming “I Survived the Great Stock Panic of 2008”. The last few months' market action has been so unprecedented, and so brutally unforgiving to trade, that emerging from it ready to keep trading is an impressive feat. Many traders have lost everything because of their leverage while many more have totally given up on trading.
As a speculator, I found this stock panic very painful like everyone else and I can't wait for the markets to resume some semblance of normalcy. But as a student of the markets, the last few months were the most fascinating I have ever witnessed. People are going to be talking about and studying the Great Stock Panic of 2008 for generations. Yet we got to live through it and witness its fury firsthand in real-time!
This panic's broader stats, seen through the lens of the flagship S&P 500 (SPX) stock index, defy belief. In less than 4 weeks in October, the SPX plummeted 27.1%. With the various circuit breakers implemented after the infamous 1987 crash (20.5% in a single day), I didn't think such a fast selloff in the biggest and best US companies was even possible anymore. Yet it still happened despite the mechanisms designed to retard a panic.
In less than 3 weeks in November, starting the morning after the US elections, the SPX plunged another 25.2%. Overall from late August, US stocks fell an unthinkable 42.2% by their November 20th lows! Reading these sobering stats, you'd think this would have been a shorting paradise. But the great majority of the shorts were slaughtered too. This panic was so hyper-volatile that successful directional trading betting long or short was nearly impossible.
Volatility, or the amplitude and frequency of daily moves in the stock markets, is fascinating to study. Excessive volatility is a double-edged sword, offering traders both great opportunities and big risks. To help my own trading, I have done many volatility studies covering many markets in the past. Back in March 2008, after the SPX's biggest daily rally seen since October 2002, I researched SPX volatility.
Volatility studies help illuminate the probabilities underlying big daily moves, the knowledge of which can really help traders. If you know how likely in the past a given up or down day has been in the SPX, and you see one today, you can better understand how to trade it. If it is very rare, odds are the trend that big day capped is likely to reverse, at least for the short term. Knowing this, you can trade accordingly.
In my March study , I looked at the SPX's daily moves going back a decade or so, to 1998. I found that truly huge moves by SPX standards ran 4%+ in either direction. From January 1998 to March 2008, there was just a 0.4% chance of seeing a giant 4%+ up day and a 0.2% chance of seeing a giant 4%+ down day. In other words, 99.4% of the SPX days over this span had less than 4% close-to-close swings.
With the SPX dominated by elite blue-chip stocks, it just wasn't particularly volatile. Kind of like comparing oil supertankers to speedboats, large market-cap companies just can't move as fast as small-cap ones. And as of early May before this latest selling started, the ultimate blue-chip elites of the Dow 30 dominated the SPX. These 30 companies, 6% of the SPX's listings, made up a whopping 34% of its market cap.
So over many decades, a perception of safety in large caps developed. While they would indeed fall in a bear market, they shouldn't fall particularly fast. Investors relied on their relative price stability. But provocatively the Great Stock Panic of 2008 radically redefined what is possible in SPX volatility. Elite large-cap stocks bounced around with dizzying speed and ferocious intensity. It was crazy.
Trying to understand this panic's extreme volatility as a whole, I made this first chart. Since 4%+ days were exceedingly rare in my earlier SPX volatility study, I decided to label all the 4%+ days since May. They barely fit there were so many! While I attempted to trade through them all, this strategic perspective really drives home just how extraordinary this panic was. Extreme volatility literally became the panic norm.
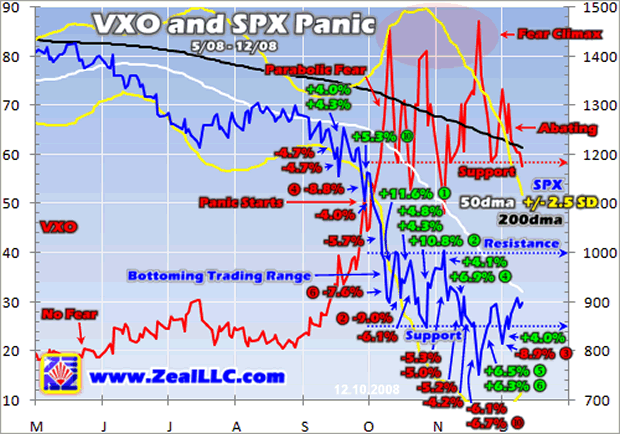
Between September 15th and December 2nd, a short 56-day span, there were no fewer than 27 4%+ daily close-to-close moves in the SPX! This is a staggering 48.2% of the days compared to just 0.6% of the days in the decade before March 2008. So if you had a tough time trading this chaos like me, don't feel too bad. No one has ever seen anything like this before. It was the mother of all stock-market anomalies.
15 of these 27 goliath moves were down days with 12 being up days. This is only 56%-to-44% in favor of big down days in this hyper-volatile time, which is kind of surprising considering how far the SPX plunged in this panic. As you can see in this chart, big down days (or a couple of them) were usually followed immediately by big up days. This created unprecedented choppiness that killed all directional trades.
The modern S&P 500 stock index wasn't launched until March 1957, but it was back-calculated to 1950. Sometimes on CNBC you'll see analysts discuss SPX action before 1957, but they are mistaken. Prior to 1957 the S&P 90 was the equivalent index, and it is sometimes appended to the S&P 500 to take the data back to 1918. But in strict terms, what we know as the S&P 500 today has only been around for 51 years.
The biggest historical study possible of this index includes the back-calculated data to January 1950, almost 59 years of daily trading. Considering that the average investor's investing lifespan is probably 40 years between first having material surplus capital to invest and then retiring, nearly six decades is a lot of data. I combed it all, trying to understand just how unprecedented this panic volatility truly was.
Incredibly, 6 of the SPX's 10 biggest up days ever happened since September 30th! They are all labeled above with the numbers in circles next to the percentages starting at the best SPX day ever, October 13th's epic 11.6% surge. Since big up days tend to mark V-bounces kicking off major bear rallies, and this was the biggest up day ever, I started betting heavily long in mid-October. But boy this panic humbled me, continuing lower even after such a once-in-a-lifetime daily rally.
5 of the SPX's 10 biggest down days ever also happened since September 29th. October 15th's 9.0% loss, December 1st's 8.9% loss, and September 29th's 8.8% loss came in 2nd, 3rd, and 4th respectively as the biggest daily selloffs ever after the notorious October 19th, 1987 crash. When 6 of the 10 biggest up days and 5 of the 10 biggest down days in history all cluster together within a tight 45-trading-day span, you know we just witnessed something special that will probably never be seen again.
This panic was unique even among stock panics. If you are interested in why it happened, its driver, I discussed that in the current issue of our Zeal Intelligence newsletter. But the result of such insane volatility is that all traders got crushed. Historical market knowledge, time-tested indicators, contrarian bets against popular sentiment, nothing worked in this panic. It was the most challenging environment ever.
When discussing volatility, we can't overlook implied volatility. So I included the VXO S&P 100 implied volatility index in the chart above. The panic started in late September when the VXO went over 50, the traditional fear apex even in severe bear markets. Yet this time fear climaxed over 80 several times, levels that defy belief. And this panic won't end until the VXO falls under 50 and stays there once again.
Encouragingly, fear is abating as represented by the VXO. At its current pace of decline, it won't be long until it falls under 50 again and this panic ends. We humans are remarkably adaptable. Put us in a bad situation, no matter how unpleasant, and it doesn't take us long to adapt to it. Market conditions that terrified traders in early October have now grown kind of routine. We are all growing numb to extreme volatility, which really undermines fear. And once fear starts evaporating rapidly, this panic is over.
And since panics drive stock prices to irrational and unsustainable lows, when this panic ends we are likely to see a monster rally. It may just be a mighty bear rally, but it may also prove to be a new cyclical stock bull within this secular bear. I suspect the latter, given the ridiculous levels of fear this panic generated. And if this proves to be the case, now is a great time to add heavy long exposure in beaten-down stocks. My favorite sector in which to ride this coming rally is the incredibly oversold commodities stocks.
Back to the task at hand, I built a couple histograms to better understand the amplitude (how big) and frequency (how often) of SPX daily moves in normal conditions as a baseline and then in the Great Stock Panic of 2008. This first chart shows the distribution of all SPX trading days between January 1950 and August 2008. Until you understand this baseline, you can't comprehend how extraordinary the panic was.
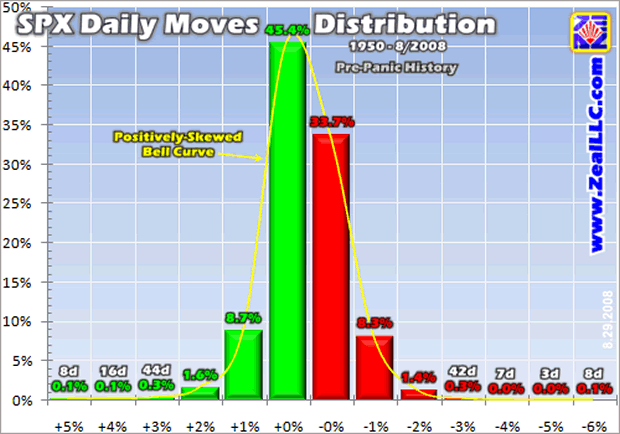
These bars are inclusive for their integer, so the +1% bar for example includes all daily gains between 1.00% and 1.99%. As you can see, the great majority of the SPX days, 79.2%, were what I have long considered “unchanged”. Unless the SPX moves by 1%+ in either direction on a given day, I consider that day in isolation pretty irrelevant. Sub-1% moves (when not considered as part of a trend) are random noise.
And while unchanged days are common, big moves are very rare. This distribution is normal and expected, and forms a classic statistical bell curve as the yellow line connecting the bars illustrates. Due to monetary inflation and real economic growth generally driving stock prices higher over decades, this bell curve is positively skewed. Unchanged up days are much more likely than unchanged down days.
Indeed the stock markets are pretty sedate most of the time. Sometimes years can pass between episodes of notable volatility. But don't forget that even though most of this 14,760-day span since January 1950 was calm, it had plenty of famous episodes of fear and volatility. It encompasses the 1966-to-1982 secular stock bear , the brutal 1973-1974 cyclical stock bear culminating in the October 1974 stock panic, the infamous 1987 crash and its aftermath, the 1998 financial crisis spawned by the Russian debt default, and the nasty early-2000s cyclical bear. Countless mini-selloffs also dotted this long span of time.
Despite all this history, so much turmoil, prior to the Great Stock Panic of 2008 the SPX only saw 24 days with gains greater than 4%. This works out to a trivial 0.2% probability. And there were only 18 days that saw losses of greater than 4%, 0.1% of all days. Big 4%+ daily moves are exceedingly rare. So no matter how much you knew about market history, that knowledge couldn't prepare you for this panic.
So if you are mad at yourself for not trading an unprecedented anomaly well, you are wasting your time. If you are angry with a professional managing your money for getting hit, realize everyone was killed in this panic. No matter where you had capital (in stocks) you still would have gotten hammered. Like for a sudden tornado spawning out of nowhere, the only course of action is to weather it, survive, and keep on trading after it passes.
I built a second histogram that illustrates the daily moves distribution from September 2008 to today, only in the Great Stock Panic of 2008. Of course I realize this is not quite an apples-to-apples thing to compare an exceedingly long period of time to an exceedingly short one. Nevertheless, it is very relevant. And if the percentages bother you, the absolute number of days that giant SPX moves occurred will not.
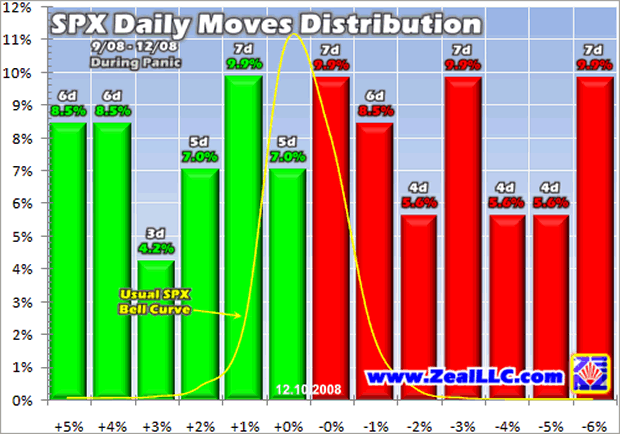
This mess is about as far from a normal bell curve as you can get. Giant days, both to the upside and downside, were as common as unchanged days during this panic. I superimposed the same yellow bell-curve line from the earlier pre-panic-SPX-history histogram on top of this one for comparison. This wacky distribution just drives home how weird this panic truly was. No one has ever seen anything like it before.
Compared to a historical probability of 0.2%, during this panic 16.9% of the days had 4%+ daily gains. Compared to 0.1% since 1950, in the last few months 21.1% of the days had 4%+ daily losses. You could try and argue this away based on the vastly shorter sample time of this panic compared to the entire SPX history before. But the raw numbers of days quickly short-circuit any such effort to downplay this event.
Prior to September 2008, the SPX only had 24 days with massive 4%+ gains. Since September, we've seen 12 more such days! On the downside, before this panic the SPX only had 18 days in its history with huge 4%+ losses. During this panic, we've witnessed another 15 days! We are talking about 58+ years here compared to about 3 months . Over this short panic span, the 4%+ up days grew by 50% and the 4%+ down days grew by 83%! This panic volatility was off the charts, totally unpredictable based on history.
Certainly interesting, but what do you do with this knowledge? There are a couple primary applications. First, as I discussed earlier, no one has ever seen anything like this event before. And even if you were bearish and short, as I was between January and early October, the hyper-volatility made it nearly impossible to launch profitable trades in recent months. Nothing works in such extreme choppiness.
So it is pointless, and destructive, to second-guess your trades made in September and early October when the markets still appeared to be guided by historical precedent. There is really no way to prepare for an event never before witnessed. All trading is based on history to some extent, gaming norms established over decades. But when those norms suddenly blow apart, virtually all trades are going to simultaneously blow up. Prudent traders can't live in constant fear of some unthinkable event.
For decades now, peripheral fears have existed that debt was unsustainable so a collapse was coming. Remember that book “Bankruptcy 1995: The Coming Collapse of America” from the early 1990s? It highlighted deep, and very real, structural problems in American debt (public and private). Yet time has proven it would have been irrational to pull out of the markets because of it. One would have missed the tech boom of the 1990s and then the commodities boom of the 2000s, both exceedingly profitable bulls.
Rome gradually waned in power for centuries before falling, and Great Britain has been a fading power for the better part of a century now. While we do have plenty of big problems in the US, and the locus of global power is gradually slipping away, our fall probably won't happen fast. The point here is there are always end-of-the-world-as-we-know-it theories on the edge of the markets that implore you to sell everything and never come back. Yet somehow the markets continue to function just fine and people generate great wealth.
A stock panic is scary, but it doesn't mean the end of the world. Nor a coming depression, as I discussed in depth in the new issue of Zeal Intelligence (free for first-time e-mail-PDF-edition subscribers ). During stock panics, irrational fear spirals out of control which drives stock prices to unthinkable lows. But as soon as rationality returns, stock prices recover. Which brings us to the second application of this extreme-volatility knowledge.
Extreme events like this are extreme simply because they don't happen very often . So when one does happen, the biggest mistake to make is to extrapolate it out into infinity. We have a natural human tendency to do this, to assume the present is going to be the new norm for the future. You see this all the time after natural disasters. Some small town hasn't had a big flood in 500 years, then they have one, so all of a sudden the residents are all paranoid and cower at every rain drop. They expect more 500-year floods constantly.
Obviously this is highly irrational. After an exceedingly-low-probability event, the odds of another one in the near future are virtually nil. The hyper-extreme volatility we've witnessed in the stock markets in the last few months doesn't mean it will continue forever into the future. Much more likely after such a crazy event we won't see another one in our lifetimes. The markets hate extremes and always revert to means after one. After such a panic, this means radically reduced volatility and a major stock-market rally.
At Zeal we too certainly took our lumps in this panic, it wasn't fun from an investing and speculating standpoint. Nevertheless, we refuse to let herd mentality override cold rationality. The extreme volatility is already abating, and after such a massive fear event a major rally to bleed off the fear is almost certain. Thus we are positioning our capital accordingly, launching new trades particularly in beaten-down commodities stocks to ride the coming rally.
Join us today! Subscribe to our acclaimed Zeal Intelligence monthly newsletter to capitalize on an event so rare that no one has ever seen it before. The sheer levels of fear driven by such volatility were so irrational on the downside that the subsequent upside will probably end up breaking a lot of records as well. Betting long during a stock panic is the ultimate high-potential contrarian play!
The bottom line is the stock volatility witnessed during the Great Stock Panic of 2008 was off the charts. It was literally unprecedented even for a stock panic. Never before have the stock markets been so volatile, and so unforgiving, for so long. But the very extremeness of this episode argues strongly against its sustainability. The markets abhor extremes so hyper-volatility must yield to normal and then low volatility.
If you can take the long view, suppress your own emotions and ignore the mainstream herd's, the opportunities presented by this stock panic are vast beyond belief. Since there is blood flowing in the streets, and no one wants stocks, fortunes will be made by the brave few contrarians willing to buy when everyone else is selling. I am going to be one of them, and you can be too.
By Adam Hamilton, CPA
So how can you profit from this information? We publish an acclaimed monthly newsletter, Zeal Intelligence , that details exactly what we are doing in terms of actual stock and options trading based on all the lessons we have learned in our market research. Please consider joining us each month for tactical trading details and more in our premium Zeal Intelligence service at … www.zealllc.com/subscribe.htm
Questions for Adam? I would be more than happy to address them through my private consulting business. Please visit www.zealllc.com/adam.htm for more information.
Thoughts, comments, or flames? Fire away at zelotes@zealllc.com . Due to my staggering and perpetually increasing e-mail load, I regret that I am not able to respond to comments personally. I will read all messages though and really appreciate your feedback!
Copyright 2000 - 2008 Zeal Research ( www.ZealLLC.com )
Zeal_LLC Archive |
© 2005-2022 http://www.MarketOracle.co.uk - The Market Oracle is a FREE Daily Financial Markets Analysis & Forecasting online publication.