Stock Market Crash Wave Count Update
Stock-Markets / Elliott Wave Theory Dec 19, 2008 - 12:57 PM GMTBy: Mike_Shedlock

 Catch A Wave - Brian Wilson, Beach Boys: Catch a wave and you're sittin' on top of the world.
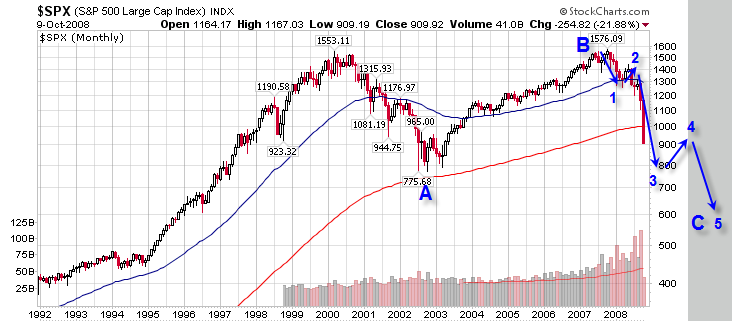
There is another interpretation of "catch a wave". That interpretation is Elliott Wave. I talked about waves at length on October 10th in S&P 500 Crash Count .
Non E-Wavers can skip to the end for another idea about how and when bear market rallies end.
Here is a clip from the above link after which there will be an update as to where we are.
Possible Pattern

Wave 4 Up
Look for wave 4 up to be choppy and overlapping (ups and downs in seemingly random patterns). 4 up will be tough to play. It is best to avoid it unless you are extremely nimble. At the time of that post, the S&P was in a wave 3 of 3 down. We are now in a wave 4 up. People keep asking me "Is the wave 4 over yet?" Everyone is itching to get short again it seems, and arguably that is a contrary indicator.
Bear in mind there is still some debate as to where we even are.
Afraid To Trade is asking Which Elliott 4th Wave Are We In Currently?
There's a rather large debate currently brewing among Ellioticians regarding exactly which Elliott 4th Wave we are experiencing - though there's widespread agreement we are in a 4th Wave Counter-rally. Let's look briefly at both sides of the argument, and what it might mean for the near future - don't miss this post.
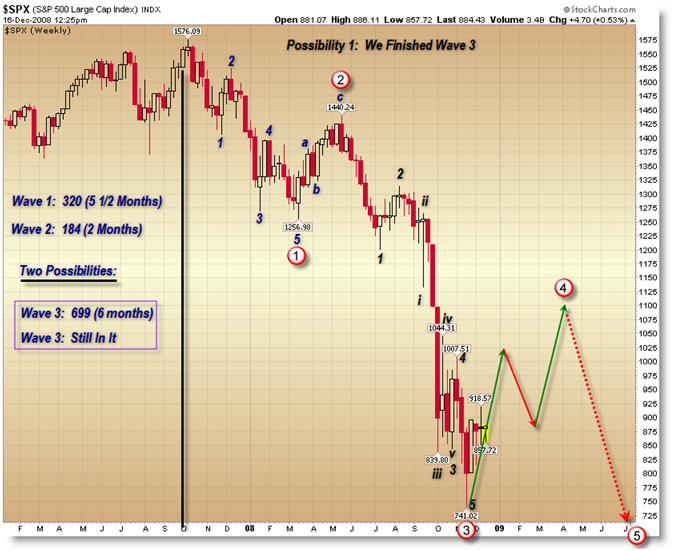
I'll present the first argument first. Elliotticians are generally in agreement until October 2008, in that we all generally agree that Waves 1 and 2 have transpired… but that's where the agreement stops. The first argument states that the massive (and destructive) 3rd Wave down has completed at the November price low of 746 on the S&P 500, and that we are currently in a large-scale 4th Wave which should take us to at least 1,000 to 1,100 on the S&P 500 … before embarking on a final 5th Wave down perhaps mid-2009.
Let's look at the proposed wave count for this argument:

Please read the rest of that article for another completely different wave count.
The above chart depicts my count (more or less). However, I do not care for that precise pattern or that time frame. And I must point out that there are still other valid counts. I am not going to display them but one of them is a giant ABC that would have us retracing this entire move down all the way back up to S&P 1400 before heading back down.
Readers know that I think a retrace to 1400 is preposterous even if it is a "valid" count.
With all these possibilities, a very reasonable person mighty suggest "It seems you are saying the charts suggest we either go up or down unless we don't".
To an extent that is true. However, not all valid counts have the same probability. And unlike others we ignore the minor 4's and instead play the major 4's (in the chart above the 4 that is circled).
But interestingly, whether or not this count is correct, we are in a 4 of some kind up. The way that plays out and the divergences that show up along the way will provide clues as to exactly what the count is.
Corrective waves are notoriously difficult to count because there are so many different ones. Corrections are by their very nature sloppy affairs with lots of overlaps.
The point of technical analysis is to not get every move right, but to pick entry and exit points that provide some degree of safety. Besides, who cares if it is 4 of 3 or a bigger wave 4 as long as one is surfing the wave up?
Anyway, yes I still think we are in wave 4 up. Furthermore I see no reason to suspect that 1008 or higher will not be reached.
Bear Market Rallies Often End On Good News
Here is another idea I have that has nothing to do with E-Wave at all:
The market may rally in a sloppy choppy fashion until Obama is inaugurated and signs the bill Nancy Pelosi has waiting, with an overshoot of 1-3 days, culminating in a big gap and crap event.
This thesis is based on the idea that major bear market rallies frequently end on good news, not bad news. Likewise, bull market corrections often end on bad news. With that in mind, the market may be rallying now in expectation of a huge economic stimulus package, something that the news media and most economic pundits thinks is "good news" even if the reality is otherwise. Wasting money is never good news.
Under this scenario, the rally lasts until Obama signs that economic stimulus bill plus a 1 to 3 day euphoric blowoff or gap and crap when the world realizes that a true recovery was actually postponed by the recovery package.
This theory may or may not happen, but the key now is that regardless of "why", and until proven otherwise, we are still in a choppy overlapping wave 4 up. Either catch the wave or stand aside. Swimming against the tide is simply no fun.
By Mike "Mish" Shedlock
http://globaleconomicanalysis.blogspot.com
Click Here To Scroll Thru My Recent Post List
Mike Shedlock / Mish is a registered investment advisor representative for SitkaPacific Capital Management . Sitka Pacific is an asset management firm whose goal is strong performance and low volatility, regardless of market direction.
Visit Sitka Pacific's Account Management Page to learn more about wealth management and capital preservation strategies of Sitka Pacific.
I do weekly podcasts every Thursday on HoweStreet and a brief 7 minute segment on Saturday on CKNW AM 980 in Vancouver.
When not writing about stocks or the economy I spends a great deal of time on photography and in the garden. I have over 80 magazine and book cover credits. Some of my Wisconsin and gardening images can be seen at MichaelShedlock.com .
© 2008 Mike Shedlock, All Rights Reserved
Mike Shedlock Archive |
© 2005-2022 http://www.MarketOracle.co.uk - The Market Oracle is a FREE Daily Financial Markets Analysis & Forecasting online publication.


