


Gold's Inverse Relationship to the U.S. Dollar
Commodities / Gold & Silver Dec 20, 2008 - 03:54 PM GMTBy: Merv_Burak

 As the U.S. $ Index and the price of gold bullion seem to be moving in opposite directions one wonders once more who is leading and who is following (albeit in opposite direction)? More importantly, where is each going?
GOLD : LONG TERM
Despite a couple of days on the down side at the end of the week, that did not obliterate the positives from the early part of the week. The early positives were able to further improve the long term rating of gold from last week and that improvement held till the end of the week. The price of gold closed on Friday (COMEX Feb 2009 futures last price) above the long term moving average line although the line slope is still in a downward direction. The long term momentum indicator (daily data version) climbed above its neutral line during the week and although it has reversed direction is still above its neutral line and above its positive sloping trigger line.
Although the daily volume action is relatively low the cumulative effect over the past few months has moved the volume indicator above its long term trigger line and the trigger has turned upwards. The volume indicator is also now above its level from the Sept/Oct high levels. All in all, the long term rating must now be classified as BULLISH although it is in a very precarious position and very little downside activity could reduce that rating quickly. This now confirms the bullish signal given by the long term P&F chart several weeks ago. That signal is still valid.
INTERMEDIATE TERM
On the intermediate term everything is still looking rosy. The Price is above its positive sloping moving average line and the momentum indicator remains in its positive zone above its positive trigger line. As for the volume indicator, it remains above its positive trigger line. All is still indicating a BULLISH intermediate term rating.
SHORT TERM
Things change in the short term first and here we see a possible change in progress. On Wednesday gold just touched the upper (resistance) trend line of a gentle up trending channel and reacted. The reaction has quickly broken below a more aggressive, shorter term support trend line of another up trending channel. This has also resulted in gold moving below its very short term moving average line although that line slope is still to the up side. It looks like the immediate direction of least resistance is towards the down side and gold may be heading back to the lower support trend line of the larger channel. For now gold remains above its positive sloping short term moving average line and the momentum indicator remains in its positive zone although already heading lower and is below its negative trigger line. As things stand today I must still rate the short term as BULLISH although understanding that things are heading towards a possible reduction of rating very soon.
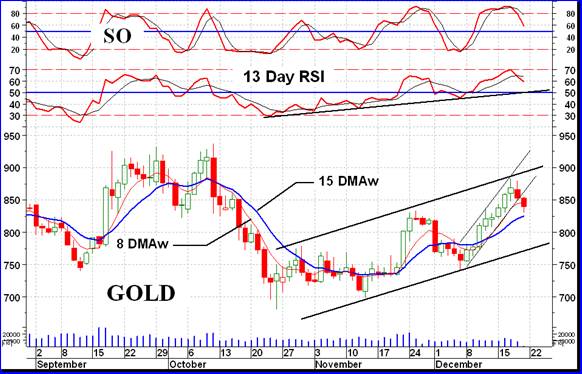
As mentioned above, the immediate direction of least resistance is now to the down side. The down side volume on Thursday was very low indicating a lack of speculative interest on the down side. Friday's volume of activity in the basic stock markets was quite high. As I do notb have the gold volume on Friday it will be interesting to see if that perked up as did the stock market. If so, it might have a further negative implication to the gold trend but we'll have to see on Monday what the Friday volume was.
SILVER
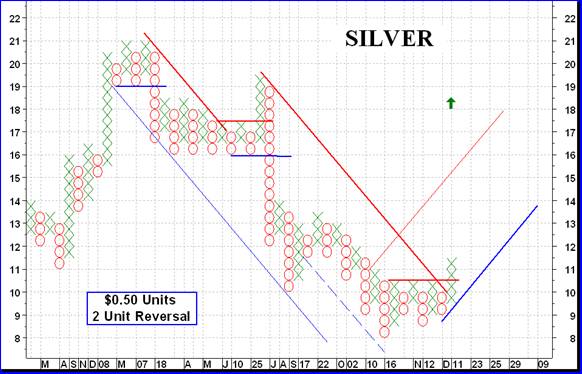
Well, silver has finally broken out of its consolidation zone and is now into a bullish trens with the initial projection to the $18.50 level. Although the end of the week activity was on the down side that still does not detract from the present bullish scenario. How this is affecting the stocks one only needs to go to the Table of Precious Metal Indices (below) to see that the Merv's Silver Indices did just fine, especially the “quality” stocks.
When an Index (or stock) makes its initial break out THAT is the most dangerous time for the move. It could be a false break-out and therefore needs watching, especially for the initial few weeks of the move. A couple day reaction is not unusual but one needs to be careful that this is not a reversal back to the down side due to sudden reversals of market conditions (or just plane old fashion manipulation). For now, however, things are looking good.
PRECIOUS METAL STOCKS
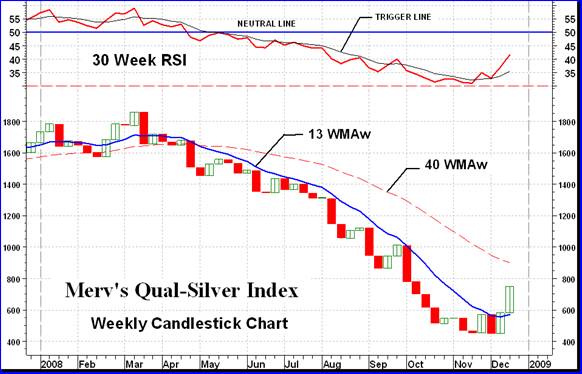
It was another positive week for precious metal (gold and silver) stocks with the average increase in the various Indices being about 4%, give or take a couple of %. The Merv's Qual-Silver Index was the noted exception to this performance. As an Index of only 10 quality silver stocks it could be quite volatile at times, as it was this past week. All stocks in that Index gained double digit gains with 6 stocks gaining well over the 20% mark and one gaining almost 100% during the week. It looks like silver stocks really caught on this past week and when things turn bullish it is usually the “quality” stocks that move first. The more speculative stocks will usually come on strong sometimes later after speculators have a chance to really grasp the new trend and have more confidence in it. For now, however, “quality” rules.
It should be noted that although the “quality” silver stocks have taken off the Qual-Silver Index has NOT YET moved over into a long term bullish position. The chart shown here shows that the Index is still below its negative sloping long term moving average line and the long term momentum indicator is still in its negative zone. Both are moving aggressively towards a break out but are not quite there yet. As one can see, the momentum indicator is above its trigger line and the trigger itself has turned to the up side. Both events suggest an improving situation in the underlying strength of the Index move. One notes that the momentum usually shows this strength, often in advance of a turn around in the Index itself.
Merv's Precious Metals Indices Table
CHRISTMAS
Christmas Time is here so I think I'll be taking some time off from the weekly commentary. I should be back with the commentaries on Jan 10 th 2009 .
A MERRY CHRISTMAS and a very HAPPY NEW YEAR to all.
By Merv Burak, CMT
Hudson Aero/Systems Inc.
Technical Information Group
for Merv's Precious Metals Central
For DAILY Uranium stock commentary and WEEKLY Uranium market update check out my new Technically Uranium with Merv blog at http://techuranium.blogspot.com .
During the day Merv practices his engineering profession as a Consulting Aerospace Engineer. Once the sun goes down and night descends upon the earth Merv dons his other hat as a Chartered Market Technician ( CMT ) and tries to decipher what's going on in the securities markets. As an underground surveyor in the gold mines of Canada 's Northwest Territories in his youth, Merv has a soft spot for the gold industry and has developed several Gold Indices reflecting different aspects of the industry. As a basically lazy individual Merv's driving focus is to KEEP IT SIMPLE .
To find out more about Merv's various Gold Indices and component stocks, please visit http://preciousmetalscentral.com . There you will find samples of the Indices and their component stocks plus other publications of interest to gold investors.
Before you invest, Always check your market timing with a Qualified Professional Market Technician
Merv Burak Archive |
© 2005-2022 http://www.MarketOracle.co.uk - The Market Oracle is a FREE Daily Financial Markets Analysis & Forecasting online publication.