


Gold and Stock Market Bear Attack Warning
Stock-Markets / Financial Markets Dec 21, 2008 - 06:21 PM GMTBy: Chris_Vermeulen

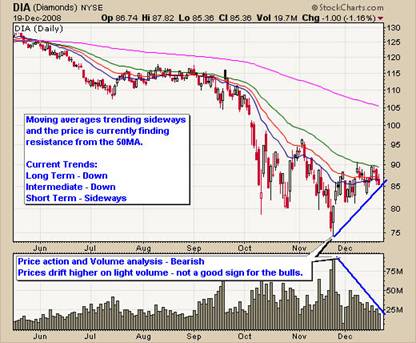
 Broad Market Outlook: - Friday the market closed mixed with light volume due to the holiday season. I always use the DOW (DIA) as a market indicator for the overall strength. The chart below shows a simple chart on where the market stands. Currently all the moving averages are trending down or sideways as the market trades at resistance. Prices have been drifting higher on light volume which is not a good sign for the bulls (longs). We are at a point now where the market is going to make a nice run higher or possibly another leg lower.
I bought DIA at $83 and just sold it last week at $86.50 as I would rather lock in a profit in case the price drops violently again. It's better to avoid a crash (or short it) because if the market does move higher I just buy again. It's a much better alternative than taking the risk of another round of selling.
DIA Exchange Traded Fund – Broad Market Barometer
Gold's (GLD ETF) Outlook:
GLD closed lower on Friday. GLD had a long upper wick candle last week, which generally indicates that a reversal or small pull back could occur, which we got later in the week.
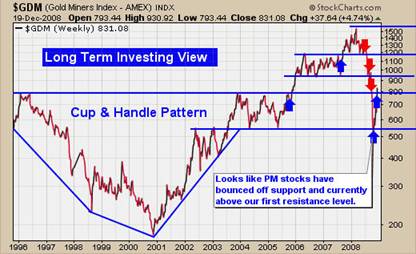
GLD Long Term View
The 13 year gold miner's index chart shows a very large cup and handle pattern, which is a long term bullish pattern. Prices have eroded sharply this year, pulling the index back down to a major support level in October. November prices bounced sharply higher off this level. We will keep our eye on this chart, as the gold market unfolds.
Gold Miner's Index
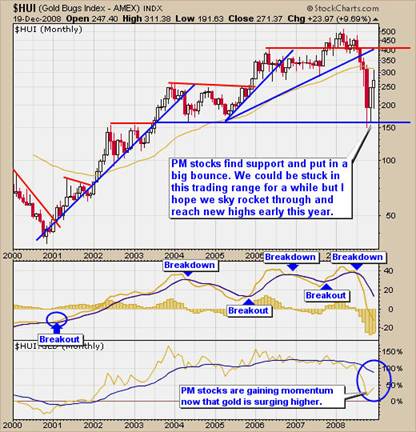
The Gold Bugs Index is a great indicator and generally I find it leads the price of gold for up to 4 days on the daily chart. The monthly chart of the HUI below shows a very clear picture, as to where we stand for gold and gold equities. Again we have had a solid bounce off support, but what we really want to see here is the HUI to continue climbing faster than the price of gold, which will help confirm the bottom for gold prices. It is important to note that bear markets tend to pull all stocks down with it, which is why the ratio between the price of gold and gold stocks is so extreme. As sellers force stocks down in fear of losing more money, investors are slowly buying gold, as it's a safe haven during times like these, which in return is providing some support for gold.
Gold Bugs Index – Monthly Chart of HUI
Gold's Short Term View
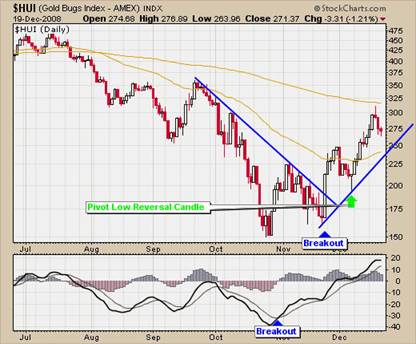
The daily HUI chart (gold Stocks) is something I pay close attention to, simply because gold stocks generally out perform the price of gold in rallies. As you can see in the chart below, the gold bugs index has made a higher low and a higher high. This is generally the first sign of a trend change. If the HUI does not break below our support trend line and we get a bounce, then we will be looking to buy gold equities and gold with low risk setups (risk under 3%).
Gold Bugs Index – Daily Chart
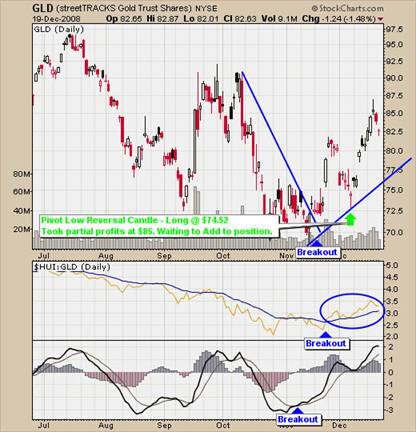
Short Term Gold (GLD ETF) Prices
The GLD exchange traded fund provided a great reversal pivot low two weeks ago, as we took a long position with a tight stop of less than 3% risk. As you can see in the chart below, there were several indicators pointing to higher prices as gold stocks made a massive run higher, out performing the price of gold and the momentum gave us an early signal, that a shift of price action could occur. Trading GLD I find provides very accurate signals, if your patient and risk is minimal for each trade.
Gold Prices – GLD Gold Exchange Traded Fund – Daily Chart
Gold and Broad Market Summary:
Gold (GLD) and gold stocks have had a great run higher and some profit taking stepped in last Thursday and Friday by the looks of it. Thankfully the reversal candle on Wednesday gave us a reason to lock in some profits, as we sold some of our position before the price pulled back the following two days. We continue to hold some of our position, anticipating a small pullback as the price corrects before another leg higher. We will be looking to add to our position if we get a bounce off our support trend line with a reversal candle and risk under 3%.
As for the broad market, I'm hesitant to hold a position, which is why I am in cash other than this gold trade. If the broad market drops, I don't want to have a long position in equities. If they start to rally on heavy volume confirming there are legs behind the move, I will simply buy when the risk is below 3%. I don't chase trades, I let them come to me, when the risk is low and the odds are on my side.
If you have any questions you can contact me at: www.TheGoldAndOilGuy.com
By Chris Vermeulen
Chris@TheGoldAndOilGuy.com
Please visit my website for more information. http://www.TheGoldAndOilGuy.com
Chris Vermeulen is Founder of the popular trading site TheGoldAndOilGuy.com. There he shares his highly successful, low-risk trading method. For 6 years Chris has been a leader in teaching others to skillfully trade in gold, oil, and silver in both bull and bear markets. Subscribers to his service depend on Chris' uniquely consistent investment opportunities that carry exceptionally low risk and high return.
This article is intended solely for information purposes. The opinions are those of the author only. Please conduct further research and consult your financial advisor before making any investment/trading decision. No responsibility can be accepted for losses that may result as a consequence of trading on the basis of this analysis.
Chris Vermeulen Archive |
© 2005-2022 http://www.MarketOracle.co.uk - The Market Oracle is a FREE Daily Financial Markets Analysis & Forecasting online publication.