


Why Falling VIX Could Mean NO Stock Market Rally
Stock-Markets / Volatility Dec 22, 2008 - 11:10 AM GMTBy: Marty_Chenard

 The answer to a subscriber's puzzling question: "The VIX goes down, and the S&P moves up. The VIX goes up, and the S&P goes down. But, sometimes the VIX goes down and instead of going up, the S&P moves in a sideways trading range . Can you tell me why?" Thanks, DJ
Thanks for the question, it is an important one because if you don't understand why, then you will not trust the VIX (Volatility Index) as an indicator. Investors need to trust their indicators, and when they can't trust them, they need to know why.
The reason you can't figure out when a down trending VIX produces a sideways movement on the S&P is because you are missing an important indicator that you should be watching WITH the VIX.
Today, we will show you two charts so you can see what you need to do.
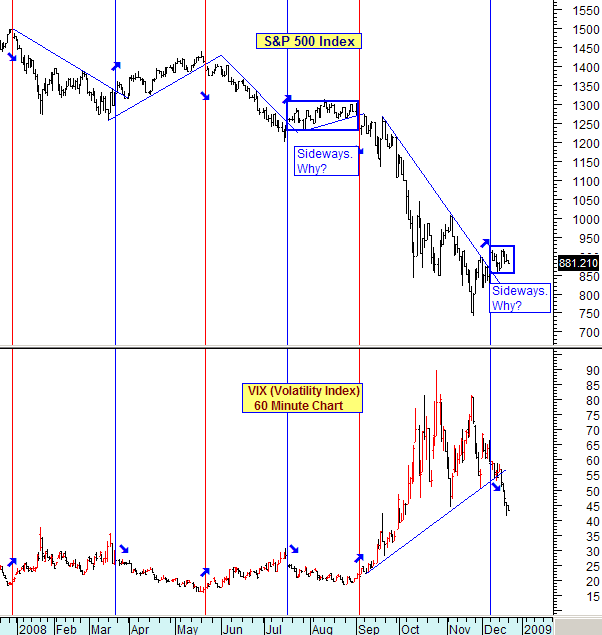
The first chart is probably what you are looking at. It is a chart of only the S&P 500 and the VIX on a daily basis.
I marked the 6 times the VIX and S&P gave reversal indications in 2008. In July/August the VIX started a down trend, and the S&P faltered and went into a sideway trading range. And now, as of December 19th. the VIX started a downtrend, but the S&P has only been moving sideways . See the chart below.
So, what is the missing ingredient that would tell you that the S&P "was likely to move in a trading range" instead of having a nice up trend? See the next chart ...
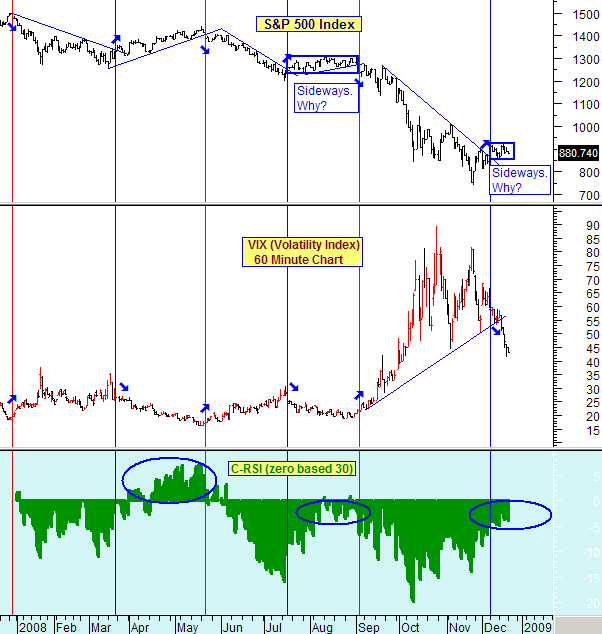
This is the same chart as above, except we added your missing ingredient.
The missing indicator you need to add is a Relative Strength Indicator for the S&P 500. Set this indicator with a value of 30 on a day chart.
We used a 30 RSI indicator below, but we zero-base it on our paid website so investors don't need to interpret the level of the RSI and what it means. A zero (0) C-RSI is the same as a traditional RSI with a value of 50 which is neutral. (We reprogram the RSI to be zero-based, because that way, it is extremely easy to read it with just a quick glance.)
So, let's relook at the first chart, with the zero-based RSI now added in the chart below.
There were actually 3 occasions that the VIX went into a down trend in 2008. The first one was in the March to May time period and it produced a nice upside rally.
The second occasion resulted in a disappointing sideways move that just couldn't keep moving up.
What was the difference in these two different outcomes ? The C-RSI was positive in the first event, and negative in the second event. See the blue circles on the C-RSI and you will clearly see why the second occurrence was stillborn.
So now, it is December and we just had the VIX drop below support. Many investors got excited and thought that the S&P was going to charge up in a Santa's rally. Instead, the S&P 500 only moved sideways with disappointment.
So, where has the C-RSI been while this is happening? If you look at the chart, you will see that it is clearly in Negative territory ... and as long as it stays there , a dropping VIX won't give you what you are looking for. As long as the C-RSI remains in negative territory, a dropping VIX will only give you a market with a sideways trading range.
I hope you have found the answer to today's question beneficial as a new tool in your charting endeavors. For those who may want to share today's update with friends or colleagues, a "Send this Page to a Friend" link can be fou nd below.
P. S. We always use a C-RSI based indicator on our paid website so investors can quickly and easily understand what a standard RSI is really saying without interpreting the level it is at.
____________________________________________________________________
*** Feel free to share this page with others by using the "Send this Page to a Friend" link below.
By Marty Chenard
http://www.stocktiming.com/
Please Note: We do not issue Buy or Sell timing recommendations on these Free daily update pages . I hope you understand, that in fairness, our Buy/Sell recommendations and advanced market Models are only available to our paid subscribers on a password required basis. Membership information
Marty Chenard is the Author and Teacher of two Seminar Courses on "Advanced Technical Analysis Investing", Mr. Chenard has been investing for over 30 years. In 2001 when the NASDAQ dropped 24.5%, his personal investment performance for the year was a gain of 57.428%. He is an Advanced Stock Market Technical Analyst that has developed his own proprietary analytical tools. As a result, he was out of the market two weeks before the 1987 Crash in the most recent Bear Market he faxed his Members in March 2000 telling them all to SELL. He is an advanced technical analyst and not an investment advisor, nor a securities broker.
Marty Chenard Archive |
© 2005-2022 http://www.MarketOracle.co.uk - The Market Oracle is a FREE Daily Financial Markets Analysis & Forecasting online publication.