


Silver and Gold More Than Just A Christmas Carol
Commodities / Gold & Silver Dec 26, 2008 - 03:49 AM GMTBy: Oxbury_Research

 Silver and gold, silver and gold
Ev’ryone wishes for silver and gold
How do you measure its worth?
Just by the pleasure it gives here on earth
... or so goes the well-known Christmas carol you've probably heard several times already during this holiday season. But aside from the decorations in your home and office, how much gold do you actually own right now in your portfolio?
After all, gold is considerably more valuable than merely "the pleasure it gives here on earth", as you can see from the following 5 x 3 point and figure chart which shows the price since its 1982 low:
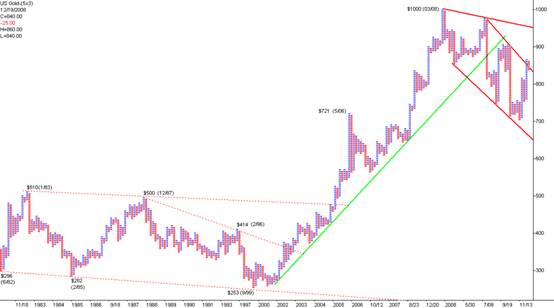
This chart (courtesy of http://www.the-privateer.com) will remain the same until the spot future gold price closes between $US 864.90 and $US 835.10. That's because a point and figure (P&F) chart represents filtered price movements over time. P&F charts tend to eliminate insignificant price movements that often clutter bar or candlestick charts, highlight key support/resistance levels and focus upon major trend lines.
(If you're not familiar with P&F charts, they're composed of alternating rising columns of X's and falling columns of O's, with each X or O "box" representing a fixed price range ($5 in this case). A new column is begun each time the price moves a set amount in the opposite direction (3 x $5 in this case).)
From this chart we can see that there is good support at the $700 level and that a close over $980 would indicate that the next leg of the bull market is truly underway. For now, the gold price is butting heads with the downward trend line highlighted in red.
A Closer Look At The Gold Price Action
By way of comparison, here's how the action looks with a more conventional candlestick chart:
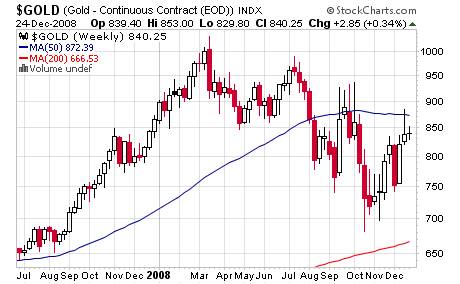
Here we can see that the resistance at the 50 week moving average is proving to be quite difficult resistance indeed. Gold has failed to penetrate it on five separate occasions dating back to September.
But does this mean that gold's luster has faded?
Not if you ask Peter Schiff and other astute observers who don't take a conventional, mainstream view of the economy and financial policy (and who have been proven to be right far, far more often than the idiots you'll see assuring you that "everything will be OK any day now" on the television programs).
According to Mr. Schiff, "Gold has actually held up very well compared to other asset classes. If you look at the price of gold relative to its peak, it's only off about 25%, whereas if you look at stock markets around the world, most are off 50% or more, certainly if you price them in US dollars."
What's more, he added: "if you look at gold in terms of other currencies, recently you've seen all-time record highs in the price of gold in South African rand, in Australian dollars, in Canadian dollars. So gold has actually had a very strong, stealth move when viewed from the prism of something other than the US dollar."
That's primarily because the US dollar has been exceptionally strong lately even though US economy has been the epicenter of this year's economic shockwave. “Strong” is relative though, as the dollar has dipped rather noticeably in recent weeks and is unlikely to show any significant gains in the near future:
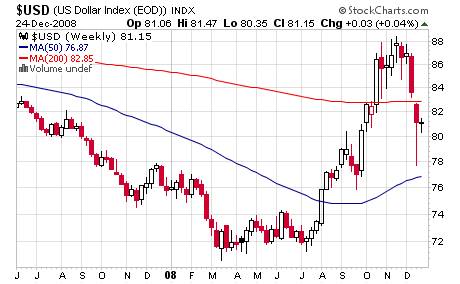
After all, consumer spending -- a mainstay of the U.S. economy which accounts for more than two-thirds of the nation's gross domestic product -- isn't exactly skyrocketing at the moment.
Dark Days Are Ahead When Even
Christmas Shopping Is Unfashionable
Consumers are not opening up their wallets, according to new government reports indicating that consumer spending and orders for durable goods fell even further in November. Individual spending fell an additional 0.6% last month after falling 1% in October. This marks the fifth consecutive monthly decrease.
And even though consumer prices themselves are falling (particularly in the energy sector due to falling oil prices), people are still reluctant to charge once more unto the shopping breach. Who can blame them, really?
After all, everyone's cutting back. Orders for durable manufactured goods declined a seasonally adjusted 1% to $1.9 billion in November too. Meanwhile inventories of manufactured durable goods increased $1.6 billion or 0.5% which marks the sixteenth increase in the last 17 months and now features the highest level since the Commerce Department began tracking that measure in 1992.
There's some good news, though. A 1% rise in real income helped generate a 2.8% savings rate compared with 2.4% in October.
Loosely translated: no one's buying and goods are slowly piling up on the shelves as consumers hoard their cash in the face of economic uncertainty.
Could the fact that initial filings for state jobless benefits rose to 586,000 for the week ended December 20 have anything to do with this? That's a 26-year high and up from a recent high of 575,000 claims reported earlier this month.
Also, the median U.S. home price plunged 13% in November from a year earlier. This is the largest drop on record and almost certainly the biggest decline since the 1930s according to the National Association of Realtors. What's more, foreclosure-related sales accounted for 45 % of the month's transactions.
Russian Down A Steep Slope: The Slavic Bear Hibernates
But take heart, things could be worse. If you were Russian, you'd be "enjoying" the benefits of your central bank officially devaluing your ruble currency for the third time in a week . The ruble is down 18% and now sits near an all-time low as the central bank spent spending 27% of reserves (more than $162 billion) "defending" the currency since August.
That's primarily because the Russian government based a significant part of its revenue on oil prices and the current price per barrel of $37.43 is a tad lower than the $70 needed to balance the 2009 budget. Whoops!
And as if that's not enough, BNP Paribas SA estimates investors withdrew $211 billion from Russia since August due to confidence concerns. A budget deficit for the first time in a decade is in the offing and the government will be forced to use its reserve fund to cover the financing gap. At least they have one, which is more than you can say for the U.S. government.
And while you might feel like cheering over the woes of America 's former Cold War enemy, we could be looking at a future snapshot of the U.S. economy playing out today.
After all, no one is being spared the bite of the recession bear, not even the mighty Russian bear itself.
Good investing,
Disclosure: no positions
Nick Thomas
Analyst, Oxbury Research
Nick currently works in the wheat futures pit at the Minneapolis Grain Exchange and brings his up close and personal experience with commodities markets exclusively to you. "I think that instead of getting our panties in a bunch over the atrocities currently being undertaken by our Federal Reserve, we should identify the investment opportunity formed by the Federal Reserve's ongoing creation of financial imbalances."
Oxbury Research originally formed as an underground investment club, Oxbury Publishing is comprised of a wide variety of Wall Street professionals - from equity analysts to futures floor traders – all independent thinkers and all capital market veterans.
© 2008 Copyright
Nick Thomas
/ Oxbury Research - All Rights Reserved
Disclaimer: The above is a matter of opinion provided for general information purposes only and is not intended as investment advice. Information and analysis above are derived from sources and utilising methods believed to be reliable, but we cannot accept responsibility for any losses you may incur as a result of this analysis. Individuals should consult with their personal financial advisors.
© 2005-2022 http://www.MarketOracle.co.uk - The Market Oracle is a FREE Daily Financial Markets Analysis & Forecasting online publication.