Treasury Inflation Protected Securities Investment Tip
Interest-Rates / Investing 2009 Dec 26, 2008 - 06:26 PM GMTBy: Richard_Shaw
 Treasury Inflation Protected Securities (TIPS) are more attractively priced than ordinary Treasuries of the same maturity.
About Ordinary Treasuries
Ordinary Treasuries pay a fixed amount of interest twice per year and mature at a fixed principal amount. Treasury interest for US-persons is exempt from State and local income taxes, but not Federal income taxes. Treasuries can reasonably be held in taxable or tax deferred accounts.
About Treasury Inflation Protected Securities (TIPS)
The principal amount of a TIPS adjusts to increase with inflation or decrease with deflation, as measured by the CPI. However, the maturity value of a TIPS is the original principal amount (”par”) or the adjusted principal, whichever is greater.
TIPS pay interest twice a year, at a fixed rate (not a fixed amount). The fixed rate is applied to the inflation/deflation adjusted principal. Therefore, the interest payments rise with inflation and fall with deflation.
If inflation occurs while you hold TIPS, each interest payment will be higher than the last. If deflation occurs, each interest payment will be lower than the last. At maturity, the principal payment will not be less than par, but could be more than par if net inflation occurred during the life of the bond.
Both the interest earned as well as any increase in principal value on a TIPS are taxable at the Federal level for US-persons. Since the increase in principal value is a non-cash income, TIPS are best held in tax deferred or tax-free accounts.
Inflation/Deflation After 1929 Crash:
There is a debate as to which past bear market is most like the current bear market. In reality each bear and each bull is different — different economies, different regulations, different banking institutions, different political and geopolitical conditions, etc. — but comparisons are inescapable.
If we use the 1929 crash as a model, the post-crash inflation/deflation pattern may be helpful in thinking about TIPS.
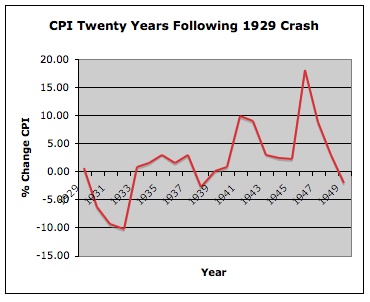
The 5-year annualized deflation following the 1929 crash was 4.74%. The 7-year annualized deflation was 2.76%. For 10-years, the annualized deflation was 1.92%. For 20-years to 1949, the annualized change in CPI was an inflation of 1.82%.
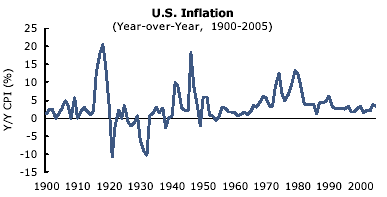
A longer-term CPI chart from 1900 to 2005 from a 2006 PIMCO article provides a comprehensive view of CPI changes:
Implied Inflation in Current TIPS Pricing:
By subtracting the yield of a TIPS of a particular maturity from the yield of an ordinary Treasury bond of the same maturity, you obtain the implied annualized inflation over the time to maturity.
The three tables below show the implied inflation for 5, 7, 10 and 20 years as of January 2, July 27, and December 24 of 2008.
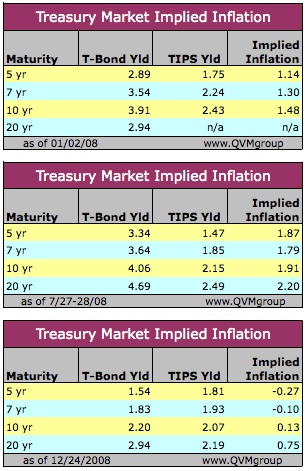
You can see that the implied inflation at the beginning of 2008 was positive, and that it rose to a larger positive number by late July. However, now it is implying deflation for 7 years, with a minor return to inflation after 10 years, and low inflation for 20 years.
Our Best Guess on Post-Bear Market CPI Changes:
Because of the massive global, multi-national reflationary government programs, we doubt that the 10 years following this bear market will be as deflationary as the 10 years following 1929. In fact, we are concerned about too much being done too late with consequent post-bear market inflation.
While we may have, or may be about to have, current deflation, it does not seem reasonable to us to project near zero inflation for 7-10 years as seen in current pricing. We also doubt that annualized inflation will less than 1% over the next 20 years. If those assumptions are correct, then TIPS would seem a better value today than ordinary Treasury bonds.
Relative Pricing TIPS and Ordinary Treasuries:
The following charts plot the ratio of TIP to IEF. TIP is an ETF investing in TIPS, while IEF is an ETF investing in ordinary Treasury bonds.
They aren't perfectly aligned in duration, as would be the case with individual TIPS and ordinary Treasuries of the same maturity, but the ETF comparison is a reasonable rough match for relative pricing in this discussion.
The average duration of TIP is 5.67 years, while the average duration of IEF is 6.99 years.
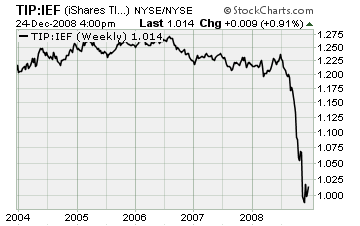
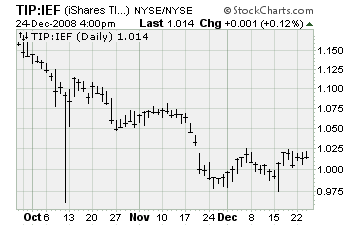
You can see by the sharply reduced ratio since mid-2008 that inflation expectations have dramatically reduced.
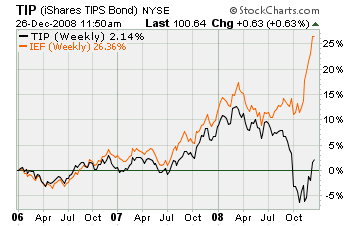
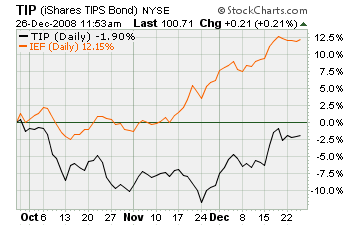
Plotting the performance of TIP and IEF separately, they look like this:
TIP versus IEF Weekly for 3 Years
TIP versus IEF Daily for 3 Months
Summary:
TIPS are anticipating no inflation for at least 7 years, minimal inflation for 10 years and low inflation for 20 years.
If inflation occurs, TIPS would appreciate in maturity value and increase in semi-annual interest payments.
If deflation occurs, they would have the same par value at maturity as ordinary Treasuries, but the semi-annual yield would decrease in line with the deflation.
Because we believe inflation is at least somewhat more likely than deflation over the next 5-10 years, and certainly over 20 years, we think TIPS are attractively priced now.
If interest rates rise due to a reduction in fear and a move out of Treasuries into riskier assets, but not due to a measured rise in Consumer Price Index, TIPS would decline in market value, as would ordinary Treasuries. However, if interest rates rise due, at least in part, to a rise in CPI, TIPS would increase in interest and market value, while ordinary Treasuries would decline in market value with interest amounts remaining constant.
For these reasons, we think investors with a desire to hold Treasury debt, should hold some TIPS as well as ordinary Treasuries (with TIPS in a IRA or other tax deferred, or tax-free account).
That said, 2+% interest, whether real (TIPS) or nominal (ordinary Treasuries) is not attractive for a large portion of most portfolios.
By Richard Shaw
http://www.qvmgroup.com
Richard Shaw leads the QVM team as President of QVM Group. Richard has extensive investment industry experience including serving on the board of directors of two large investment management companies, including Aberdeen Asset Management (listed London Stock Exchange) and as a charter investor and director of Lending Tree ( download short professional profile ). He provides portfolio design and management services to individual and corporate clients. He also edits the QVM investment blog. His writings are generally republished by SeekingAlpha and Reuters and are linked to sites such as Kiplinger and Yahoo Finance and other sites. He is a 1970 graduate of Dartmouth College.
Copyright 2006-2008 by QVM Group LLC All rights reserved.
Disclaimer: The above is a matter of opinion and is not intended as investment advice. Information and analysis above are derived from sources and utilizing methods believed reliable, but we cannot accept responsibility for any trading losses you may incur as a result of this analysis. Do your own due diligence.
Richard Shaw Archive |
© 2005-2022 http://www.MarketOracle.co.uk - The Market Oracle is a FREE Daily Financial Markets Analysis & Forecasting online publication.


