Stock Market Investment Screening for Top Yielding Dividend Stocks
Companies / Dividends Jan 05, 2009 - 06:37 AM GMTBy: Richard_Shaw
 Some of our readers have asked for a list of top yielding stocks by sector. We built a screen for that and present the five stocks with the highest trailing dividend yield in each sector plotted with the related S&P 500 sector fund.
This does not constitute a recommendation of any kind. It is a screen that produces food for thought only. There are probably some stinkers in the list and maybe some good opportunities.
The reason to use the screen would be to find positions that could yield more than buying the index, and that could be balanced among the sectors differently than stocks are balanced within dividend funds (such as DVY, SDY, and VIG).
Before presenting the results, here are the criteria we used to build the screen, showing how the universe reduced as more criteria were applied:
- All stocks covered by S&P Outlook (9,969)
- Market price >$5 (5,281)
- Paid dividends since 1998 or earlier (1,482)
- Market capitalization >= $500 million (853)
- S&P earnings and dividends strength rating B+ or better (493)
- Dividend payout ratio < 100% (390)
- Long-term debt <= 50% of capital (301)
- Trailing yield >0% < 10% (296)
We used the 10% cap on yield along with the S&P financial strength rating to minimize troubled situations. There are some stocks paying more than 10%, however, that might not be troubled. Also, some high yielding major names with more than 50% leverage, such as GE, are not included.
The filter is based on the assumption of use by a yield seeking investor who also wishes to limit the amount of leverage employed by the companies in the portfolio.
Note that we did not limit the search to stocks within the S&P 500 index, but did select stocks based on the same industry classifications used in the S&P index.
All filter data is from S&P. All yield data is from Morningstar. Charts are from StockCharts.com. The data tools for this or similar screens are readily available to retail investors from those vendors at low monthly costs.
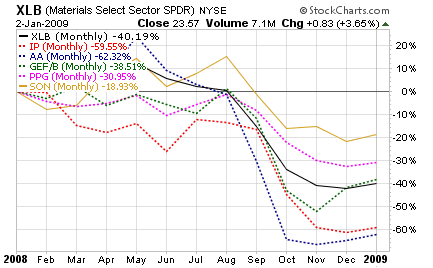
XLB (3.9%), IP (8.00%), AA (5.60%), GEF.B (5.40%), PPG (4.80%), SON (4.80%)
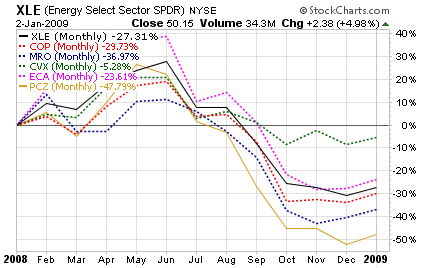
XLE (2.0%), COP (3.40%), MRO (3.30%), CVX (3.30%), ECA (3.20%), PCZ (2.70%)
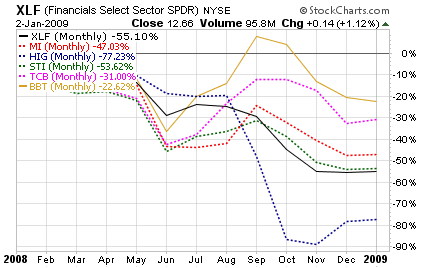
XLF (8.0%), MI (9.20%), HOG (7.4%), STI (7.20%), TCB (7.10%), BBT (7.00%)
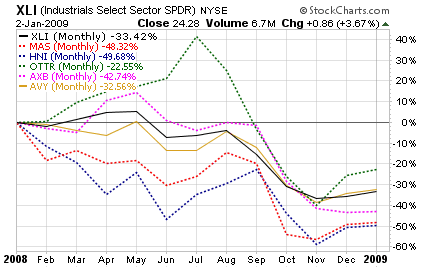
XLI (3.5), MAS (8.20%), HNI (5.20%), OTTR (4.90%), AXB (4.90%), AVY (4.80%)
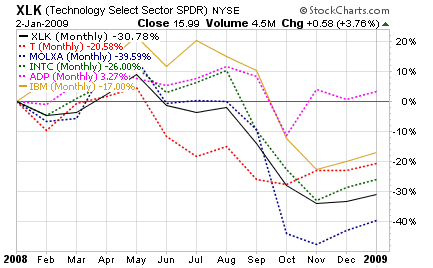
XLK (2.3%), T (5.50%), MOLXA (4.40%), INTC (3.60%), ADP (3.20%), IBM (2.20%)
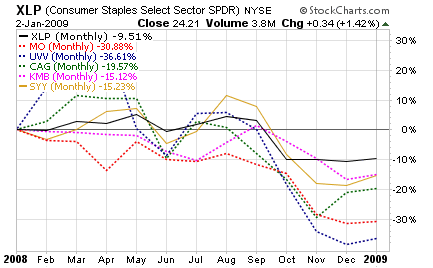
XLP (2.9%), MO (8.40%), UVV (5.90%), CAG (4.50%), KMB (4.30%), SYY (4.00%)
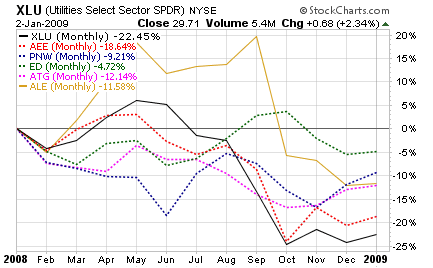
XLU (4.2%), AEE (7.40%), PNW (6.30%), ED (5.90%), ATG (5.30%), ALE (5.30%)
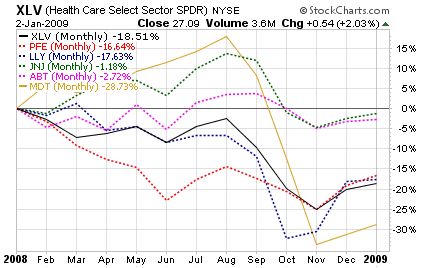
XLV (2.7%), PFE (7.00%), LLY (4.80%), JNJ (3.00%), ABT (2.60%), MDT (2.20%)
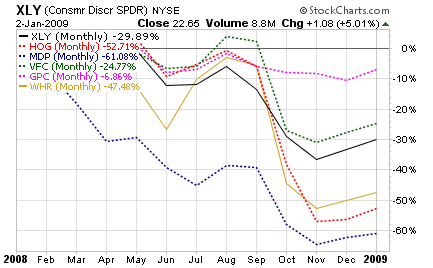
XLY (2.5%), HOG (7.1%), MDP (4.8%), VFC (4.10%), GPC (3.90%), WHR (3.90%)
Take this for what it is — a quantitative screen, and nothing more.
There is no analysis beyond strictly applying the filter criteria, which may or may not produce good results, or be suitable for you.
Not all found companies are necessarily attractive, and not all attractive high yielding companies have been found.
This filter is just a way to reduce the field of examination in the search for investment ideas. More quantitative and qualitative review is necessary to determine if any of the identified companies could be attractive investments for any particular portfolio.
Other filters generating other lists should also be evaluated.
By Richard Shaw
http://www.qvmgroup.com
Richard Shaw leads the QVM team as President of QVM Group. Richard has extensive investment industry experience including serving on the board of directors of two large investment management companies, including Aberdeen Asset Management (listed London Stock Exchange) and as a charter investor and director of Lending Tree ( download short professional profile ). He provides portfolio design and management services to individual and corporate clients. He also edits the QVM investment blog. His writings are generally republished by SeekingAlpha and Reuters and are linked to sites such as Kiplinger and Yahoo Finance and other sites. He is a 1970 graduate of Dartmouth College.
Copyright 2006-2008 by QVM Group LLC All rights reserved.
Disclaimer: The above is a matter of opinion and is not intended as investment advice. Information and analysis above are derived from sources and utilizing methods believed reliable, but we cannot accept responsibility for any trading losses you may incur as a result of this analysis. Do your own due diligence.
Richard Shaw Archive |
© 2005-2022 http://www.MarketOracle.co.uk - The Market Oracle is a FREE Daily Financial Markets Analysis & Forecasting online publication.


