


Gold Continues to Target $930 Resistance
Commodities / Gold & Silver 2009 Jan 11, 2009 - 09:04 AM GMTBy: Merv_Burak

 Back after three weeks and it looks as if nothing has happened in the precious metals. Lots has, however, happened in the stocks and especially the “cats and dogs” variety. Many, many 100% plus moves in only one or two weeks. Are we back into a real honest to goodness bull market? Let's go through our normal exercise.
GOLD : LONG TERM
First the point and figure chart shown here about a month ago. It has moved higher with the Xs and remains bullish. The present projection is unchanged at $930 for this move. Nothing on the P&F chart to indicate problems.
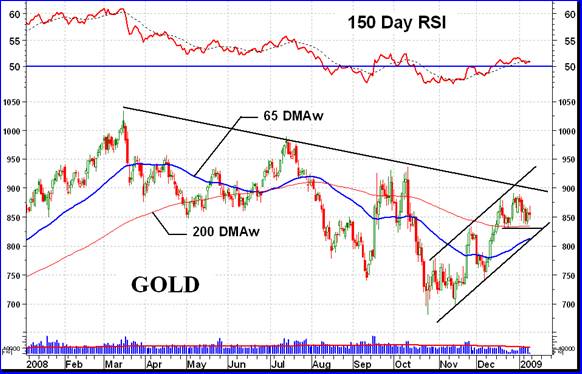
The basic bar (or candlestick) chart and indicators also seem to be in a bullish phase but here we can see some concern. First the good news. The price of gold is above its long term moving average line and the long term momentum indicator is in its positive zone. However, the moving average line slope has not quite turned to the up side and the momentum is just very slightly below its trigger line. The volume indicator is showing a positive picture (not shown on the chart) BUT the daily volume action is still pretty low. Shown on the chart is a 150 day average volume line. Here we see that the daily volume action has basically been below the average line causing the line to continue to trend lower.
Looking at the gold price trend over the past year, since its top, we see a series of lower highs and lower lows. To confirm a new bull market we should have at least one higher high and higher low. We still have neither. The chart shows an up trending channel but this is more of an intermediate term trend. It is positive but may be reacting towards its lower support line.
Despite the cautionary signs that we may not have full confirmation of a bull market, the indicators would suggest at least a + NEUTRAL rating, one level below a full bull. Once the moving average line turns upwards we would have a full bullish rating but we should wait for it. That could happen on Monday or depending upon the action it may not happen for some time.
INTERMEDIATE TERM
The up trending channel has been mention in the previous section. The action seems to be heading towards its lower support line but to get there it might end up breaking below a short term support from the recent action. That would suggest more than a trip just to the channel support. That might start a chain of support breaks resulting in a much lower price than the channel would suggest. For now the indicators are somewhat better on the intermediate term than they were on the long term. The price is well above its moving average line and the line slope is positive. The momentum indicator remains in its positive zone but unfortunately has already dropped below its trigger line and the trigger has turned to the down side. We do have an up trending support trend line on the momentum indicator which has touched the momentum at least three times for a good trend line confirmation. The momentum would have to cross this trend line first if it is considering going negative. A crossing of this trend line would probably be a strong signal that the momentum for the gold price would be turning negative with price to follow. For now, however, the intermediate term rating remains BULLISH.
SHORT TERM
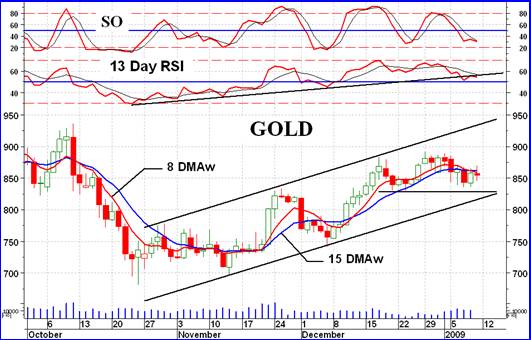
Unlike the longer term where we are still in a series of lower highs and lower lows, here on the shorter term we have been having a series of higher highs and lows. This does not look like it will continue for much longer. The higher highs are getting lower and the higher lows are barely higher than the previous one. From the looks of it that support at about the $830 level seems not to be too strong and may be breached shortly. We already have the price below its short term moving average line (15 DMAw) and the line has already turned downwards.
The short term momentum (13 Day RSI), although still in its positive zone, has already moved below its trigger line and the trigger is sloping downward. We have a well established up trend line on the momentum indicator (similar to what I mentioned for the intermediate term) that has been broken. Although the momentum has basically stayed just below the line I would expect the momentum to move decisively lower and into its negative zone. The daily volume action is still somewhat lower than I would like to see and not a positive indicator at this time. On the short term the rating has now turned BEARISH .
As for the immediate direction of least resistance, that looks to be towards the down side. The price is below its very short term negatively sloping moving average line and the Stochastic Oscillator (SO) is in its negative zone below its trigger line. I would think that, however, a close above $870 might change that direction back to the up side.
SILVER
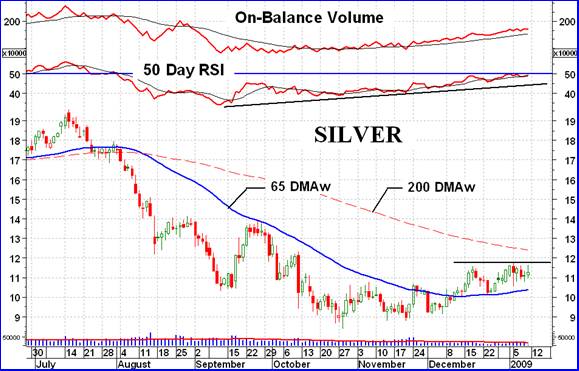
Over the past few months the action of silver has been under performing that of gold. However, looking at the indicators there are lots of plusses and minuses right now.
On the plus side the price is above its intermediate term moving average line and the line is sloping upwards. The volume indicator is in an up trend and above its intermediate term positive trigger line. The momentum indicator has been trending upwards and is just sitting on top of its positive trigger line. It is also well above its up trend line.
On the negative side the latest action was unable to make any significant new headway. The momentum indicator is still in its negative zone (although only slightly). The daily volume action has been quite low and the recent daily volume action is less than the average over the past 50 days.
On the intermediate term all these plusses and minuses might cancel each other out but going to my ratings criteria the intermediate term is still classified as BULLISH .
One more note. Comparing the action of silver with that of gold, the Relative Strength (RS) ratings in the table suggest that on the longer term gold performed better than silver, going to the intermediate term gold was still better but only slightly so. On the short term we now have silver performing better than gold. So, is silver ready to take over from gold in the future performance? The stocks are also suggesting so, except for the real speculative/gambling stocks which have once more taken the lead.
PRECIOUS METAL STOCKS
The previous week (ending 02 Jan 2009 ) was a real volatile week with many, many 100% plus gainers on the week in the Merv's universe of 160 stocks. The average price of the 160 stocks comprising the universe (including the 100 largest stocks by market value) gained 22.9% on the week. However, the gains were not evenly spread. The average price of the 30 quality stocks in the Merv's Qual-Gold Index gained only 9.0% while the 30 stocks in the Merv's Gamb-Gold Index, the gambling variety of stocks, gained an average 37.7% on the week. This past week things calmed down with most Index gains limited to the single digit. Still the gambling variety out paced the quality by plus 8.8% to a minus 4.5%.
In the old days I used to have a plus/minus 30% category. This referred to the number of stocks which gained or lost more than 30% in one week. This past week, even though it was not a terrific week, there were still 15 stocks with weekly gains above the 30% mark, one in the 100% category. I would be inclined to sit back until the market has had time to consolidate these types of gains rather than trying to chase some of these stocks. A rest period or even a reaction would not be unexpected here.
Another thing that makes me think that a rest period or reaction is getting close is the universe of 160 stocks intermediate term BULL/BEAR rating. This is now into the bullish 90% level and has very little upside left to go. With such a high bullish rating a reaction would not be a surprise prior to the next upside wave.
MERV'S PRECIOUS METALS INDICES TABLE
Well, that's it for the first commentary of the New Year.
By Merv Burak, CMT
Hudson Aero/Systems Inc.
Technical Information Group
for Merv's Precious Metals Central
For DAILY Uranium stock commentary and WEEKLY Uranium market update check out my new Technically Uranium with Merv blog at http://techuranium.blogspot.com .
During the day Merv practices his engineering profession as a Consulting Aerospace Engineer. Once the sun goes down and night descends upon the earth Merv dons his other hat as a Chartered Market Technician ( CMT ) and tries to decipher what's going on in the securities markets. As an underground surveyor in the gold mines of Canada 's Northwest Territories in his youth, Merv has a soft spot for the gold industry and has developed several Gold Indices reflecting different aspects of the industry. As a basically lazy individual Merv's driving focus is to KEEP IT SIMPLE .
To find out more about Merv's various Gold Indices and component stocks, please visit http://preciousmetalscentral.com . There you will find samples of the Indices and their component stocks plus other publications of interest to gold investors.
Before you invest, Always check your market timing with a Qualified Professional Market Technician
Merv Burak Archive |
© 2005-2022 http://www.MarketOracle.co.uk - The Market Oracle is a FREE Daily Financial Markets Analysis & Forecasting online publication.