Trigger Happy Stock Market Trading
Stock-Markets / Stock Index Trading Jan 17, 2009 - 02:33 PM GMTBy: Joseph_Russo
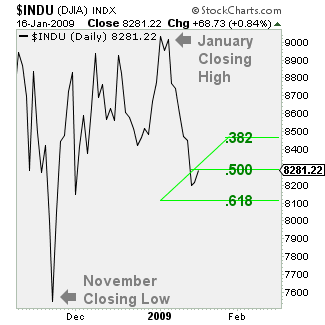
 The November Low - In direct contrast to our previous piece exploring the current onset of Super-Cycle Wave IV , we will now take a closer look at the November low, and review the price action since then relative to speculative trading strategies. The small chart plots three months of daily closes for the Dow Jones Industrials. It shows that the move up toward the January high was clearly corrective.
 The chart also illustrates that the rapid decline off the January peak is fast approaching a key 61.8% Fibonacci retracement level. These three elements, the November low, the January high, and the .618 retracement level become essential pivot points from which we shall observe the near-term course of price action. To simplify this present inflection point, the market is entitled to do one of three things. First, it may hold the recent January lows, and then continue to chop higher, further subdividing its upward corrective course toward the 9630-10640 area.
Second, it may recover only partially from the recent lows, rallying back up toward the 8675 level then once again collapse toward a retest or fresh new lows. Lastly, with the stubborn insistence of massive statist intervention, broad equity indices may also find themselves entitled to elongating a complex triangular consolidation, keeping the markets in a suspended state of limbo throughout much of Q1.
Theater of Speculation
So what does all this mean for short-term traders and long-term speculators? We will get to this shortly. In the interim, take note that we have intentionally avoided the term “investor”. We have done so because of the widespread recognition that all such endeavors into the financial sphere have been, and always will be of a speculative nature. There never has been, nor will there ever be any long-term “security” associated with investing, only the risks and rewards relative to speculations taken over time horizons of varying length. From our perspective, nothing has changed. Financial markets are what they are, and what they have always been, theaters of speculation.
Speculator vs. Trader
Now that the financial system is on life-support, we trust that any sense of security still resonating from the ponzi scheme of long-term investment is extremely fragile. Glancing back at our small chart, “Near-Term Speculators” elected to take profits and/or sell short anywhere from 8800-9000 amid four recent rallies off the November lows. They are now likely to take profits on any short sales and begin attempt at reestablishing trade on the long end from the 8000-8300 area. Until price-action proves otherwise, and despite the sizable pullback from 9000, “Long–Term Speculators” are technically justified to maintain bullish positions acquired anywhere from 7600-7700 against the November lows. In total contrast, “Short-Term Traders” position themselves all over the map on a daily basis.

Snapshots of Short-Term Trading Success
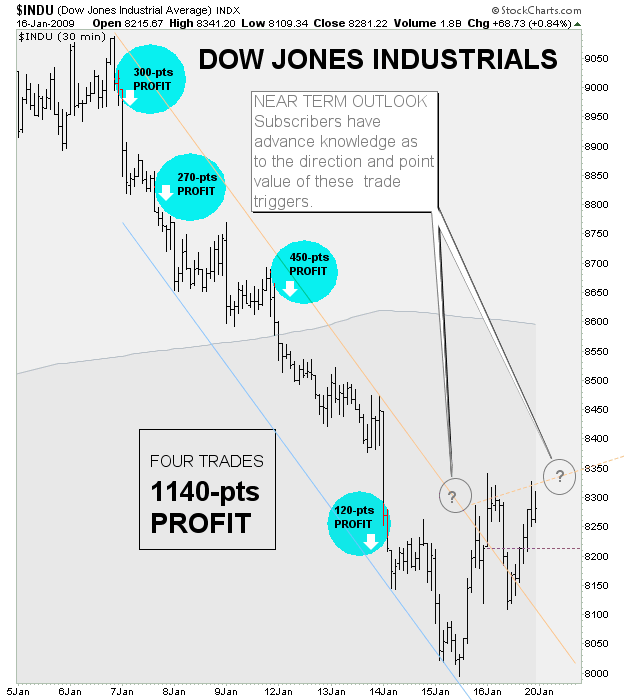
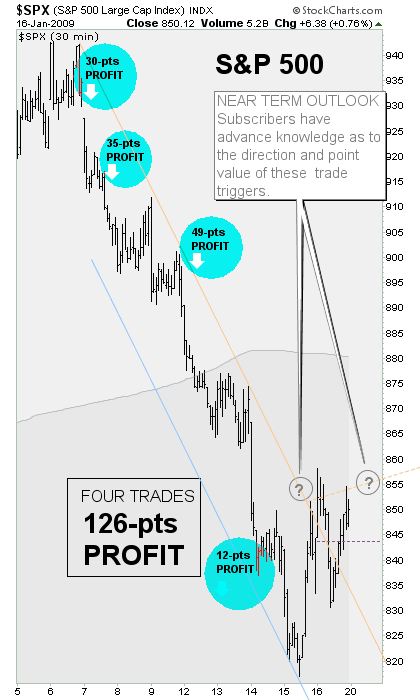
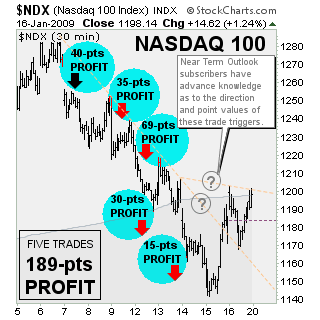
Dispersed throughout the balance of this article, we display a variety of 30-minute charts, each reflecting recent short-term trading successes in their respective markets. To impart this information to our subscribers in advance, we employ a tactical trade-trigger strategy from which we identify various trigger-points and their associated point values for short-term speculative consideration. Although a portion of these triggers will outright fail, over the past couple of weeks, this particular strategy has outperformed all others, and has delivered outstanding short-term speculative profits for those embracing its disciplines.
Short-Term Strategic Trading Cycles
Over the same period, our short-term counter-trend strategies have underperformed markedly. As with all things occurring cyclically in nature, tactical trading strategies also have cycles. One cannot expect a singular strategy to outperform 100% of the time without an appropriate season of decline and rebirth. As the current financial crises so eloquently attests, such is the essence of speculation across all time horizons.
The Complete Speculative Landscape
In our total commitment to keep one-step ahead of the entire speculative process, we go to great lengths in continually plotting course of the entire trading map for all time horizons. Doing so enables us to assess which strategies are currently working, which are muddling through, and which are languishing. Maintaining impartial resolve to such discipline allows us to deliver large profits without self-aggrandizement, and engender caution where necessary to stem losses amid situations of challenge.
 Prudently trade the Super-Cycle IV-Wave
To safely speculate on, or effectively trade the endless array of unfolding subdivisions amid SC-IV, one may subscribe to our premium technical publication.
The express focus of Elliott Wave Technology's Near Term Outlook is to help active traders anticipate price direction and amplitude of broad market indices over the short, intermediate, and long-term.
Over the past three years, we continue to hone the art of dispatching tactical trade set-ups and market forecasting into a consistent, impartial, and immensely rewarding endeavor for those who take the time to embrace it.
We deliver this unique blend of proprietary charting protocol daily, with the express intent to convey timely and profitable information. Our daily reports impart strategy-specific guidance , which strives to forecast, monitor, and calibrate market impact relative to a multitude of trading signals that are in direct alignment with distinct speculative strategies set forth in the members NTO essentials file.
Regardless of one's level of trading experience, users must allow sufficient time to become acquainted with the authors charting protocol, strategies, and tactical narratives prior to entering positions or developing discretionary trading strategies of their own. Our forthcoming E-letters should assist greatly in this endeavor.

Communications in store for 2009:
To more effectively convey dynamic trading conditions relevant to our technical publications; we are soon planning to launch complimentary E-letter briefings for anyone interested in following our work. E-letter dispatches will briefly summarize tactical trading postures across various time horizons and trading strategies. The theme of our maiden E-letter will reveal how to sell at major tops, and buy at critical bottoms. Those interested may email us to get an early seat on our mailing list.
Trade Better / Invest Smarter...
By Joseph Russo
Chief Editor and Technical Analyst
Elliott Wave Technology
Email Author
Copyright © 2009 Elliott Wave Technology. All Rights Reserved.
Joseph Russo, presently the Publisher and Chief Market analyst for Elliott Wave Technology, has been studying Elliott Wave Theory, and the Technical Analysis of Financial Markets since 1991 and currently maintains active member status in the "Market Technicians Association." Joe continues to expand his body of knowledge through the MTA's accredited CMT program.
Joseph Russo Archive |
© 2005-2022 http://www.MarketOracle.co.uk - The Market Oracle is a FREE Daily Financial Markets Analysis & Forecasting online publication.


